Introduction
Almost halfway through the season, this year’s MVP race seems even tighter than last year’s. Last year, we saw a 2-man race between Giannis and Harden. This year, Giannis and Harden again find themselves in the MVP race. But, they have some tight competition.
Searching for his 2nd straight MVP, Giannis looks like the current leader of the race. Giannis averages about 30 points, 12 rebounds, and 5.5 assists per game while leading the Bucks to the NBA’s best record. Giannis pairs these great numbers with DPOY-level defense.
Somehow, James Harden improved on his monstrous scoring last year. So far, he’s averaging about 38.5 points per game – about 8 more than 2nd place (Giannis). Harden’s insane scoring comes with unbelievable efficiency for someone shooting that much. Harden also leads the league in several advanced stats such as 538’s RAPTOR and VORP. Despite injuries to key rotation players such as Eric Gordon, Harden’s Rockets sit at 5th in the West, only 2 games back from the 2nd seed.
Beyond Giannis and Harden, Luka Doncic presents a strong case for the MVP. In just his 2nd year, Doncic has shined, putting up almost 30 points, 10 rebounds, and 9 assists per game. His performance puts the Mavs in playoff position. They’re 6th in the West, only half a game behind the 5th place Rockets.
Finally, as usual, LeBron has a case for the MVP, too. LeBron’s league-leading assist totals combined with the Lakers’ position atop the Western conference give him a shot at the award. Anthony Davis may be the main issue for LeBron’s pursuit of his 5th MVP. Davis averages almost 28 points and 10 rebounds per game while playing elite defense. The teammates might split votes, hurting both their chances to win the award.
As of now, most put Giannis, Harden, and Doncic in their top 3, followed by LeBron and Davis. Each player presents a strong case to win the MVP. So, it’s often a matter of personal bias. Do you prefer Harden’s historic offense or Giannis’ incredible two-way performance? Or do you like Doncic’s elite performance in his sophomore season?
To answer these questions, we’ll create a model that gives an objective view of the MVP race.
Methods
Last year, we created 4 machine learning models to predict the MVP. They used a variety of counting stats, advanced stats, and other factors (like team success) to predict a player’s vote share. The models correctly predicted Giannis to win the MVP, with Harden coming in 2nd place. They also predicted Paul George, Nikola Jokic, and Stephen Curry to round out the top 5 (though they got the order wrong).
This year, we’re taking a different approach. Instead of finding the expected vote share for a player, we’ll predict the probability that they win MVP. This means we’re creating classification models instead of regression models. Furthermore, last year we created complex machine learning models. Given the small size of the data set, simpler models likely perform better.
Our data set consists of every player in the top-10 of MVP voting since the 1984-1985 season. We collected all the counting and advanced stats available on Basketball-Reference for each player (so all the stats you’d see here and here). In total, we have 349 samples. Some ties/other voting instances make it that every year doesn’t have exactly 10 samples.
Voters consider more than a player’s stats when voting for the MVP. Team success and narrative play a large role in the voting. So, we added some other factors. Along with the counting and advanced stats, we considered team wins and seed. (Note that we use overall seed – meaning league-wide rank – instead of conference seed.) Furthermore, we added pre-season title odds and All-Star votes for each player. Each of these factors helps address a key part of the MVP race. We also added 538’s offensive and defensive RAPTOR ratings. RAPTOR gives us one more holistic metric to rate players.
We go back to the 1984-1985 season because Basketball-Reference only has pre-season odds dating back to then. Also, note we use All-Star vote rank among players in the top 10 of MVP votes instead of raw votes. More fans vote over time, making raw vote numbers less meaningful than rank.
In most cases, using all these features isn’t useful, as some features predict others. For example, if we know a player’s FGM and FGA, we know their FG%. If we know a player’s ORB and DRB, we know their TRB. We call this collinearity, which occurs when a feature is a linear combination of other features. Having collinearity doesn’t affect model accuracy. Instead, it only makes the coefficient estimates unstable. Because we’re not interested in the coefficients, collinearity doesn’t matter to us here. The more information we have about a player, the better.
Using all these features, we predicted whether a player won the MVP or not. So, in a given year, one player has a 1 (won MVP) and the other players have 0s (didn’t win MVP). Along with the predicted class (1 or 0), we have a prediction probability. This gives us the model’s probability that the player will win the MVP.
We created 2 models:
- Logistic regression
- Linear discriminant analysis
Both of these models are simple linear models. Given we only have 349 samples and lots of features, simpler models are better.
In a typical machine learning project, we’d split the data into training data and testing data. We’d fit our models on the training data, then test their performance on the testing data. Here, we’ll do something different. We’ll give the models data from every year except the one we’re predicting. So, if we’re predicting the 1999 MVP winner, we’ll fit the models on all our data from every year except for 1999. Then, we’ll predict the MVP and assign MVP probabilities to each player in the 1999 MVP race. This is in effect a form of leave one out cross-validation.
We’ll average prediction probabilities from the two models to create final predictions each year. This gives us a singular MVP model that returns an MVP probability for each player. (When we say “the model” from now on we’re talking about the average prediction from the two models.)
The issue with MVP prediction
The best player doesn’t always win MVP. When voting, journalists take into account narrative and popularity. Furthermore, many suspect voters have “fatigue.” This means they don’t want to see the same player win too much, so they vote for a new face.
Some factors affect voters on a player-by-player basis. For example, breaking a record sways voters (such as Westbrook’s triple-double average). A voter’s personal bias against a player hurt his chances. For example, some voters may not want to vote for Harden because of his playstyle. These factors don’t change the race often, but sometimes play a big role.
Most models ignore these factors. For example, Basketball-Reference’s MVP tracker only uses team wins, points, rebounds, and assists. They have no feature for popularity or narrative. Almost no MVP models adjust for these factors, as it’s hard to create unbiased ways to measure them.
Some of our model inputs try to solve these problems. First, along with team wins and overall seed, we have each team’s pre-season title odds rank. Pre-season win odds would be better, but title odds are available for earlier years. Title odds provide similar information, as we’d expect teams with higher title odds to win more games. Though this doesn’t capture a player’s narrative, it measures their expectations. These expectations play a key role in a player’s narrative.
Along with this factor for narrative, we considered popularity by including All-Star votes. Often times, the MVP goes to the player who “defined” a season. We’d expect this player to have more All-Star votes, as lots of fans appreciate his performance. Adding All-Star votes improved our model.
To see how these factors affect the MVP winner, we’ll create a graph.
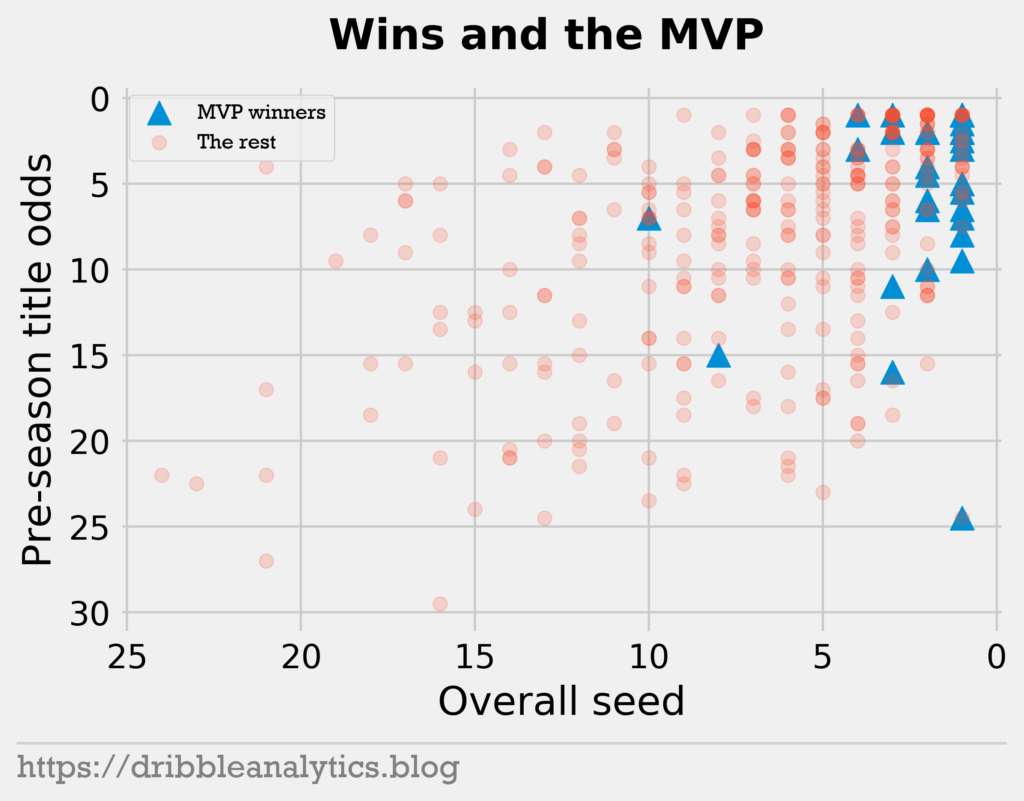
We see that only two players won MVP with an overall seed lower than 5 since the 1984-1985 season. One instance of this is Russell Westbrook’s record-breaking triple-double 2016-17 season. This is one of the most controversial MVPs in recent history. The other instance of this is Michael Jordan’s 1987-1988 season. Jordan led the league in points per game – with 35 – and steals per game – with 3.2. Jordan won MVP even though the Bulls were the 8th overall seed. But, the Bulls were the 3rd seed in the East; the West had 4 of the top 6 teams in the league that year.
Next, we’ll see how popularity and performance above expectation predict MVPs.
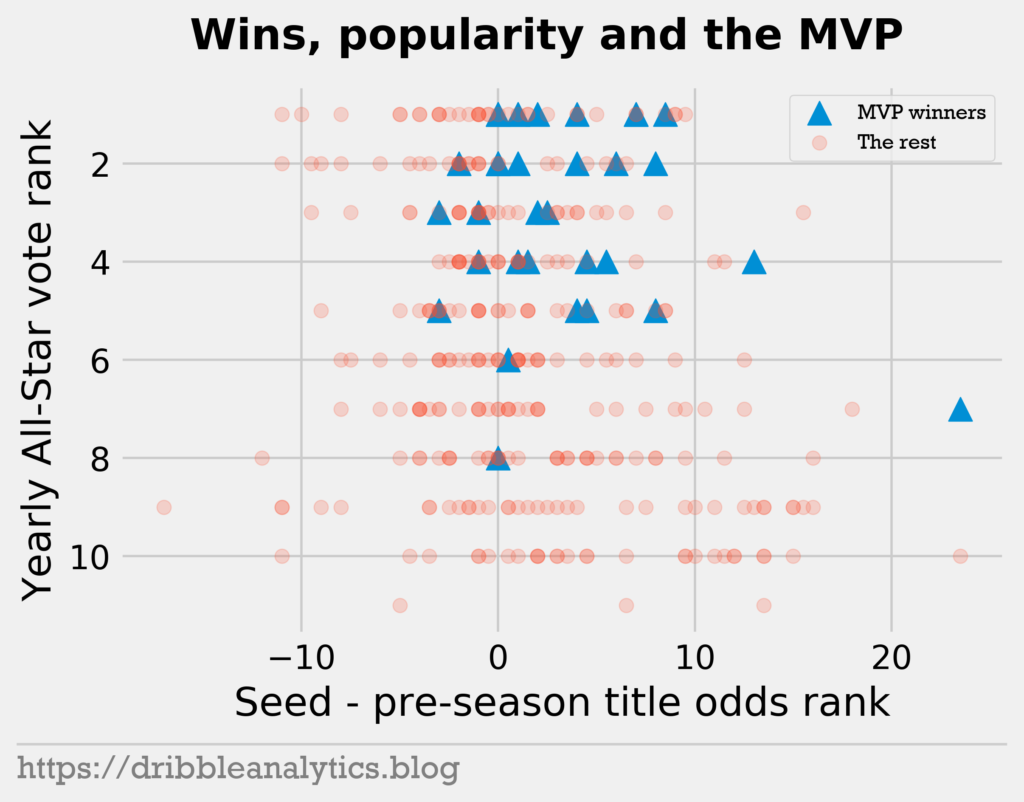
We see a couple interesting trends here. First, only 3 players won MVP while being outside the top-5 in All-Star votes. The first instance of this is Larry Bird in the 1984-1985 season. Somehow, Bird came in 6th in All-Star votes among MVP candidates that year. But, Bird was popular; he won the MVP one year before. The other two instances of this are Steve Nash (2004-2005) and Dirk Nowitzki (2006-2007). Nash never racked up points, meaning casual fans might have preferred score-first options. Dirk’s 8th-place All-Star voting is odd. He led the Mavs to the finals one year before and had already been an established 20/10 guy for years.
Notice that only 5 players won MVP while underperforming their pre-season expectations (seen in the chart by x-values below 0). These players underperformed expectations by at most 3 spots. Furthermore, 4 of the 5 players had top-3 pre-season title odds. These 4 players were Magic Johnson (1988-1989), Tim Duncan (2001-2002), Steve Nash (2005-2006), and LeBron (2011-2012). They still finished with a top-4 overall seed, satisfying that requirement. The 5th player is Russell Westbrook, whose pre-season title odds ranked 7th, compared to his overall seed of 10.
Finally, we added 538’s offensive and defensive RAPTOR ratings. Especially on defense, RAPTOR paints a better picture of player performance than common advanced stats. This gives us one more metric to rate players which may align better with a voter’s eye test.
Model performance
We tested the model by fitting it on every year of MVP data except for one. Then, we repeated this process for every year between 1985 and 2019 to create a full set of predictions. Our predictions consist of the average prediction probability from the logistic regression and linear discriminant analysis.
After finding the prediction probabilities, we ranked the players by prediction probability. This lets us compare winners, top-3, and top-5 finishes in our model to actual results.
Our model correctly predicted 74.3% of MVP winners, or 26/35. They also predicted 74.3% of top-3 finishers, or 78/105, and 71.4% of top-5 finishers, or 125/175. Meanwhile, Basketball-Reference’s MVP model predicted 36/54 MVPs (67%). Note that the years differ in the two models. Basketball-Reference predicted MVPs from the 1955-1956 season until the 2008-2009 season. Our model predicted MVPs from the 1984-1985 season until the 2018-19 season.
Our model made the following incorrect MVP winner predictions:
- Magic Johnson won in the 1988-1989 season. Our model predicted Michael Jordan would win and Johnson would come in 2nd. Jordan averaged 32.5/8.0/8.0 (points/rebounds/assists) and led the Bulls to the 9th overall seed. Johnson averaged 22.5/7.9/12.8 for the 3rd overall seed Lakers.
- Charles Barkley won in the 1992-1993 season. Our model predicted Jordan would win and Barkley would come in 2nd. The Suns were better than the Bulls, as they had the 1st overall seed compared to the Bulls’ 3rd. Jordan averaged 32.6/6.7/5.5 while leading the league in several advanced stats. Barkley averaged 25.6/12.2/5.1. Barkley won by a sizable margin here. This may be a case of voter fatigue, and Jordan won MVP the previous two years in a row.
- Hakeem Olajuwon won in the 1993-1994 season. Our model predicted David Robinson would win and Hakeem would come in 2nd. The Rockets were the 2nd seed, while the Spurs were 7th. However, Robinson averaged 29.8/10.7/4.8 with league-leading RAPTOR compared to Hakeem’s 27.3/11.9/3.6.
- Karl Malone won in the 1996-1997 season. He had a predicted probability of 79.3%, meaning he would be classified as an MVP. However, Jordan had a predicted probability of 99%, meaning Malone came 2nd. The Bulls were the 1st overall seed, while the Jazz were 2nd. Both Jordan and Malone put up great numbers. This was the 2nd tightest MVP race in our data set, as Malone had a vote share of 85.7% compared to Jordan’s 83.2%. Basketball-Reference’s model also had this error.
- Allen Iverson won in the 2000-2001 season. This was a particularly weird year. The predicted winner here – Chris Webber – had only a 12.5% MVP probability. This is by far the lowest probability for a predicted winner. The 76ers and Kings were the 3rd and 4th seeds, respectively. Iverson put up 31.1/3.8/4.6, compared to Webber’s 27.1/11.1/4.2. Basketball-Reference’s model predicted Iverson to come 5th and Shaq to win. In our model, Iverson came 4th.
- Steve Nash won in the 2005-2006 season. Our model predicted Nash to come in 5th and Chauncey Billups to win. Billups led the Pistons to the 1st overall seed, while Nash led the Suns to the 4th seed. They put up very similar stats, with Nash getting more assists and Billups leading in some advanced stats. Basketball-Reference’s model predicted Nash to come 7th, and Dirk to win.
- Dirk won in the 2006-2007 season. Our model predicted Nash to win and Dirk to come in 2nd. Dirk and Nash led their teams to the 1st and 2nd overall seeds, respectively. Dirk averaged 24.6/8.9/3.4, while Nash averaged 18.6/3.5/11.6.
- Kobe won in the 2007-2008 season. Our model predicted Kevin Garnett to win, Chris Paul to come 2nd, and Kobe to come in 3rd. Though this is Kobe’s only MVP, many believe Paul should have won here. Garnett led the Celtics to the top seed in the league. The Lakers were 3rd, and the New Orleans Hornets were right behind them in 4th. Paul led the bunch in most advanced stats. Kobe averaged 28.3/6.3/5.4, Garnett averaged 18.8/9.2/3.4, and Paul averaged 21.1/4/11.6.
- The final incorrect prediction for our model is Westbrook’s MVP in the 2017-18 season. The model predicted Harden to win, giving him a 99.3% MVP probability. Westbrook had the 2nd highest MVP probability for someone in 2nd, at 50.4%. So, this is like the Malone/Jordan race where the model would classify both players as the MVP.
From here, we can easily calculate its classification performance metrics. Note that our predicted classes here are that the player with the highest probability in a given year earns a 1 (should win MVP) and the others earn a 0 (should not win MVP). So, even though Westbrook and Malone have years with a probability above 50%, they count as a 0 because Harden and Jordan had higher probabilities in those years.
Because our model made 9 incorrect predictions and we have 349 data points, it has 94.8% accuracy ((349 – 2 * 9) / 349). The 9 incorrect predictions imply there are 9 false negatives and 9 false positives. So, the recall and precision of the model is 26/35, or 0.743. This means the F1 is 0.743.
Along with these metrics, we’ll look at metrics dealing with prediction probabilities. First, we’ll look at log loss. Log loss compares our model’s predicted probability to the real classes with logarithms. A score closer to 0 is better. Our model scored a log loss of 0.167, which is strong. For a more interpretable measure of prediction probability, we’ll use Brier score. Brier score is like mean squared error for prediction probabilities. For each point, we take the difference between the prediction probability and the actual class and square it. Then, we sum all these errors and divide it by the number of data points. So, a Brier score closer to 0 is better. The model has a Brier score of 0.044.
Finally, we’ll look at the receiver operating characteristics (ROC) curve. The ROC curve shows how our model performs when we change the discrimination threshold. By default, the discrimination threshold for any classifier is 50%. This means that any result with a predicted probability above 50% is classified as 1, and any result below 50% is a 0. The ROC curve shows the true positive and false positive rate with a changing threshold. If our probabilities are accurate, the area under the ROC will be 1. This happens if all our prediction probabilities equal the given class. If this occurred, the predictions would stay constant regardless of the threshold. So, a higher area under the ROC (AUC-ROC) is better, with a best possible value of 1.
The graph below shows our model’s ROC curve. A perfect model would have an ROC curve that goes up to the top-left corner, then right to the top-right corner. A model with no ability to distinguish between classes will have an ROC curve of y = x (shown in red). The farther we are from that line, the better.
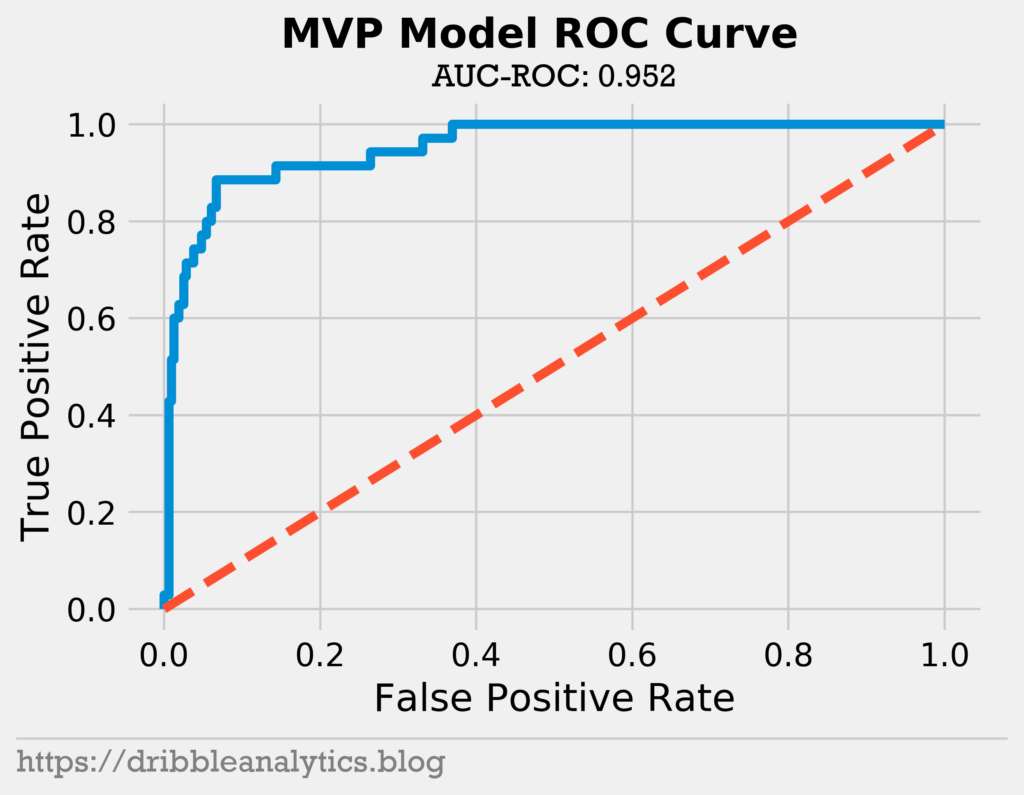
The model has an AUC-ROC of 0.952 and the ROC curve is far from y = x. Altogether, we see that our model is strong.
Results
On January 16 before any games were played, we collected the necessary data for all players. We only predicted MVP probabilities for players in the top-10 of the most recent NBA MVP ladder (January 10).
We scaled up the necessary values for the rest of the season. We also use All-Star numbers from the 3rd round of voting results.
The graph below shows the model’s result.
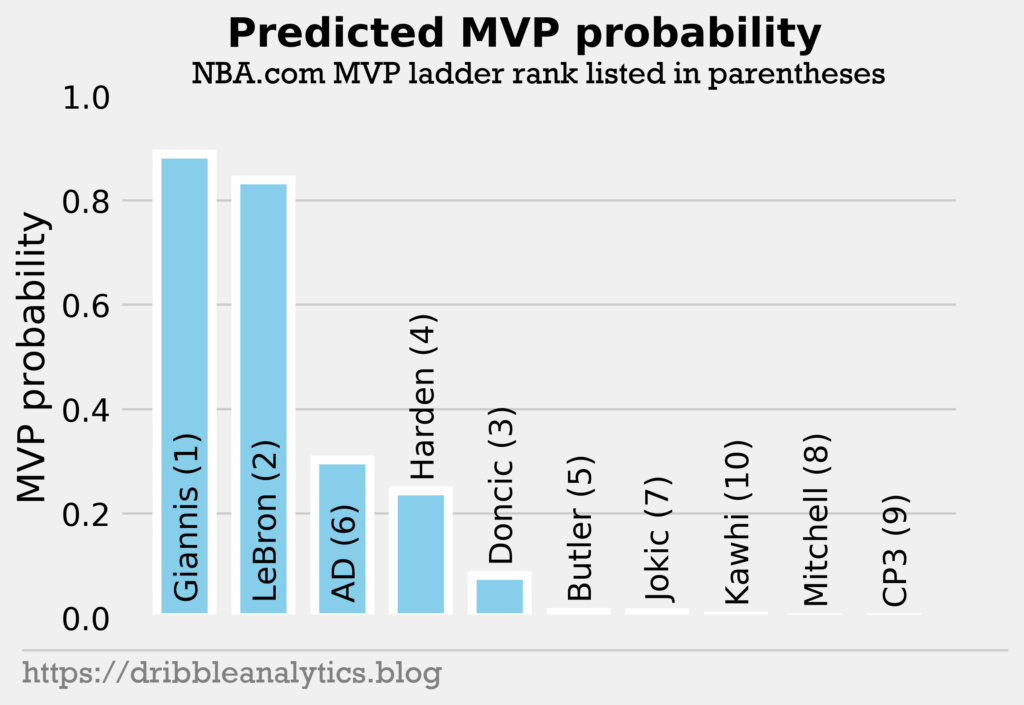
Giannis comes in 1st place, as many would expect. However, LeBron is right behind him. After LeBron, there’s a big drop in MVP probability to Anthony Davis. The fact that Harden is 4th means the model likely values winning a lot. At this point in the season, one game changes seeding a lot. This hurts Harden, as he’s currently 5th in the West and 8th overall. This is 4 spots lower than the Rockets’ pre-season title odds rank. So, the low seed combined with underperforming expectations hurts Harden. However, the Rockets are only 2 games out of the second seed in the West. This would put them at the 3rd overall seed, well within reason for an MVP winner.
Doncic also seems low for this reason of seed variability. Beyond Doncic, the remaining 5 players have a near-0 MVP probability. This is expected, as the top 5 in the model are the main 5 players discussed in the MVP race.
Conclusion
In our historical tests, the model performed well. It correctly predicted about 75% of MVP winners, and also identified a higher percentage of top-3 and top-5 finishers.
Given that we’re only halfway done with the season, a lot can change in the MVP race. This makes our current predictions volatile, especially because of the small differences in seeding. The models seem to value winning a lot, so a couple losses affect a player a lot.
Last year, we used much more advanced models and a different approach. The models gave a correct answer. Though I think this approach fits the problem more, it will be interesting to see which performs better.