Introduction
Last year, LeBron James’ 11-year All-NBA 1st team streak came to an end. The Lakers’ lack of success combined with the fact that James played only 55 games dropped him to a 3rd team spot. This year, LeBron is a lock to make the All-NBA 1st team. LeBron leads the league in assists and sits squarely in the MVP conversation with the Lakers in first in the West.
Aside from James, the 1st team seems as predictable as ever. Giannis – the current MVP race leader – will get the forward spot alongside LeBron. Davis will claim the center spot, with Harden one guard spot. The second guard spot may go to either Doncic or Lillard. If Lillard continues his incredible hot streak and leads the Blazers to the playoffs while the Mavs falter, the spot may go to Lillard. (Some may consider Doncic a forward. He’s listed as a guard on the All-Star team, so we assume he counts as a guard).
Last year, we saw a much different race. Giannis and Harden were clear 1st team players the entire season. Voters unanimously placed both players on the 1st team. Curry and George seemed likely to secure the other guard and forward spots. However, those spots were far from certain. Furthermore, Embiid and Jokic were in a tight race for the 1st team center spot.
Though this year’s first team is predictable, the remaining spots seem up in the air. For example, who deserves the 2nd team center spot? Embiid’s injuries likely prevent him from getting the spot. Rudy Gobert, Nikola Jokic, and Bam Adebayo all have strong cases to earn a spot. Given Davis will be on the 1st team, these 4 players must battle it out for the remaining 2 center spots. And that’s not even including Karl-Anthony Towns.
This tight centers race presents only one of the many close calls this year. At this point in the season, players’ stats start to stabilize, allowing us to evaluate their performance. To predict the All-NBA teams, we created a deep neural network.
Last year’s performance
Last year, we created 4 models to predict the All-NBA teams. The models performed exceptionally. The table below shows the predicted teams from the average of the 4 models:
| Average Predictions | Guard | Guard | Forward | Forward | Center |
|---|---|---|---|---|---|
| 1st team | Damian Lillard (0.947)* | James Harden (0.997) | Giannis Antetokounmpo (1.000) | Kevin Durant (0.984) | Joel Embiid (0.900) |
| 2nd team | Stephen Curry (0.947)* | Russell Westbrook (0.811) | Paul George (0.963) | Kawhi Leonard (0.884) | Nikola Jokic (0.897) |
| 3rd team | Kyrie Irving (0.713) | Kemba Walker (0.417) | LeBron James (0.551) | Blake Griffin (0.420) | Rudy Gobert (0.854) |
The asterisk indicates that Lillard and Curry had identical probabilities. We noted this spot would go to Curry. Furthermore, though Durant had a higher probability than George, we said narrative will push George over Durant. If we consider the Lillard/Curry prediction as correct, then we correctly predicted 11/15 spots. (Note that each “switch” necessary is 2 incorrect predictions. So, when we predicted George to be 2nd team and Durant 1st team, and the real result was flipped, we counted that as 2 incorrect predictions even though it’s technically 1 switch.) Each player we predicted to make an All-NBA team made an All-NBA team. The only switches necessary to have perfect predictions are George/Durant and Irving/Westbrook.
Our models’ success last year shows that we can model All-NBA selections with stats. The models looked at historical data starting from the 1979-1980 season (introduction of the 3-point line). Each year, our data set consisted of all the players to make an All-NBA team or the All-Star team. So, we had a small and arbitrary data set. Though All-Stars generally overlap with All-NBA players, there’s no reason to condition on being an All-Star. Using this data, we trained our models with the following features:
| Counting stats | Advanced stats | Team stats | Other |
|---|---|---|---|
| PTS/G | VORP | Wins | All-Star * |
| TRB/G | WS | Overall seed | |
| AST/G | |||
| FG% |
These inputs also aren’t perfect. For example, there’s no reason to use FG% instead of TS% of eFG%. There’s also no logic for the specific advanced stats we used. Lastly, team success may be unnecessary. Factoring team success creates a feedback loop. Great players make teams great, so most All-NBA-level players will play on good teams. Though there’s a few exceptions (like Trae Young), team stats won’t give us much information.
We used the models’ prediction probabilities to create the All-NBA teams. The player with the highest prediction probability went into the highest available slot in his position.
This year’s methods
This year, we improved our methods in several ways. We’ll discuss each of them below.
Data
This year, we used much more data. We collected data for every player whose rookie season came on or after the 1979-1980 season. This boundary ensures that every player played their entire career with the 3-point line.
We split our data into 3 parts: a training set, validation set, and testing set. The training set consists of 50% of the data, the validation set 25%, and the testing set 25%. We split up the data sets randomly in a stratified way, meaning we preserve class balance.
Using every player season gives us over 15,000 samples. However, among these 15,000 samples, only 511 of them made an All-NBA team. So, our data set is unbalanced. To combat this, we performed something called SMOTE.
SMOTE
SMOTE (synthetic minority over-sampling technique) is a way to create fake (synthetic) data points to balance our classes. SMOTE creates data points by assigning random weights between 0 and 1 to some neighborhood of points in a class.
We used borderline-SMOTE, which is a special type of SMOTE. Borderline-SMOTE generates synthetic data using borderline minority examples. So, we’re generating data from samples that are close to the majority examples. The hope is that the synthetic data helps the model differentiate between these borderline cases better.
Our initial data set consists of about 15,000 player samples. However, we generated several fake player samples to balance the classes.
One super important thing with SMOTE is to do it after splitting up the data. If we perform SMOTE before splitting our data into training/validation/testing sets, we’ll get misleading accuracy. This is because our model will “bleed” information; samples in the train set could be generated from samples in the test set, and vice versa. Furthermore, it’s important not to use SMOTE on our testing and validation set, because we want those sets to follow the data we’ll use to make new predictions. This is a common mistake that leads to artificially high accuracy and bad models.
We only performed SMOTE on our training set. Our validation and testing sets remain unchanged.
Features
This year, we’re using a much broader range of features. We hope these features better reflect a player’s skill.
The only features we had last year that we don’t have this year are team-based features, such as team wins and seed.
The table below lists all the features we used in our model.
| Other | Shooting | Rebounding | Passing/ball control | Defense | Catch-alls |
|---|---|---|---|---|---|
| G | FG, FGA, FG% | ORB, ORB% | AST, AST% | STL, STL% | PER |
| GS | 2P, 2PA, 2P% | DRB, DRB% | TOV, TOV% | BLK, BLK% | OWS, DWS, WS, WS/48 |
| MP | 3P, 3PA, 3P% | TRB, TRB% | USG% | PF | OBPM, DBPM, BPM |
| FT, FTA, FT% | VORP | ||||
| eFG% | RAPTOR (off. and def.) | ||||
| TS% | |||||
| 3PAr, FTr | |||||
| PTS |
In total, we have 47 features. We see that a lot of them are collinear (meaning some features directly predict another). If we construct the model in a specific way, this isn’t a problem (more on this later).
The model
We used Keras to create a deep neural network. The model consisted of 6 layers. The first layer had 47 nodes, as we had 47 features. The next layer had 32 nodes. From there, each subsequent layer had half the nodes of the previous layer until we reached 4 nodes. From then, the next layer was the output layer (only 1 node).
Each layer except for the last one uses a leaky ReLU activation. The final layer uses a sigmoid activation such that all our probabilities fall between 0 and 1.
Overfitting: regularization
A common issue in machine learning is overfitting. This occurs when a model learns the training data too aggressively. While this results in great training accuracy, it makes the model bad at predicting results from new data. In previous machine learning projects, we’d check for overfitting by looking at cross-validated accuracy metrics. Here, we can take a better approach. We designed the model to avoid overfitting.
The first way we avoid overfitting is with weight regularization. If a model has very large weights, it’s likely to overfit. A small change in input data results in a huge change in the output if we have large weights. Weight regularization fixes this issue.
There are two ways to regularize weights: L1 regularization and L2 regularization. They regularize in different ways. L1 uses the l-1 norm to regularize weights. This results in sparse coefficients, meaning we’re making several weights 0 and keeping the important ones. L2 regularization uses the l-2 norm, which results in shrinking coefficients to smaller values.
The first 3 layers of our model use L1 regularization. This helps fix any issues we’d have with collinearity, as features that don’t contribute to the model will shrink to 0. The final 3 layers of our model had L2 regularization. This shrinks the remaining non-zero coefficients.
Overfitting: early stopping
In a neural network, we’re trying to find the weights and biases that minimize a given loss function. Each time we make a full cycle through the training data, the model updates its weights. We call each cycle an epoch. We pre-set the number of epochs (in this case, 200).
The model calculates the loss function from the training data. Because we’re concerned with making predictions on new data, this could be a problem. Our new data might not mimic our training data. (In fact, it doesn’t because our training data has synthetic observations). This means that we should care about the validation loss too.
In early stopping, we stop the model from completing all the epochs to avoid overfitting. We do this by minimizing the validation loss. If the validation loss rises in a given epoch, then that weight update isn’t making our models more accurate. So, early stopping finds this minimum validation loss and uses those weights.
Our early stopping looks forward 25 epochs before stopping. This means that once we find a validation loss minimum, we look forward 25 epochs. If none of these epochs have lower validation loss, then we use the weights from the previous minimum. This allows us for optimize our weights to both our training and validation data.
Let’s visualize this. The graph below shows the model’s loss on the training and validation data throughout all 200 epochs.
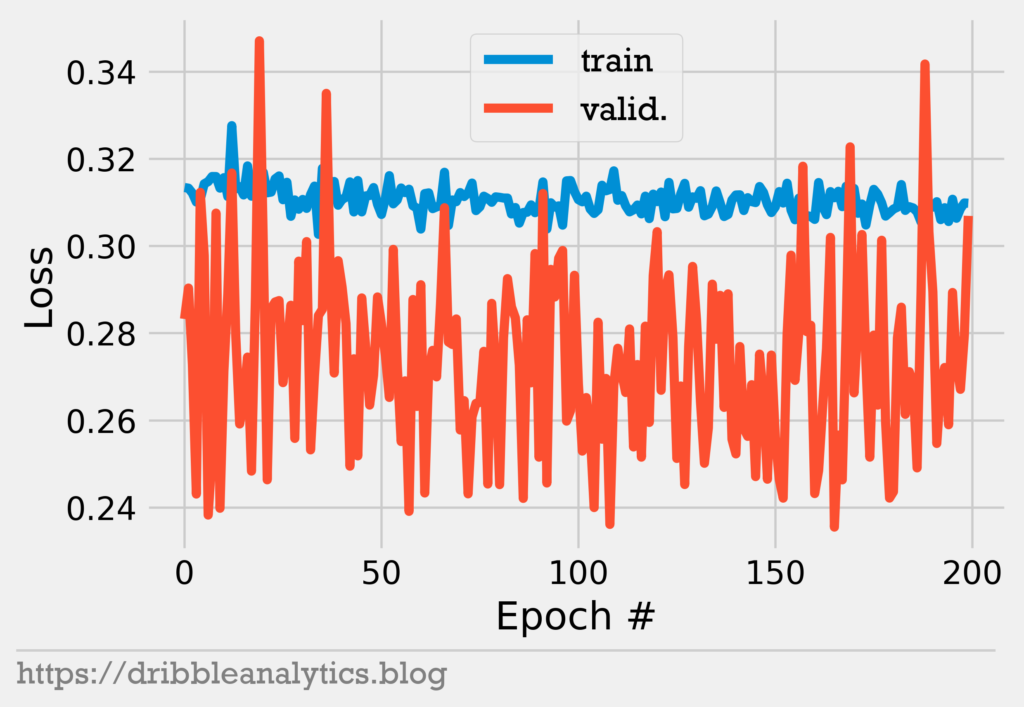
Notice that at some epochs, the loss in the validation data increases. Validation loss at epoch 200 isn’t at a minimum, so our model could be better.
The graph below shows the model’s loss with early stopping.
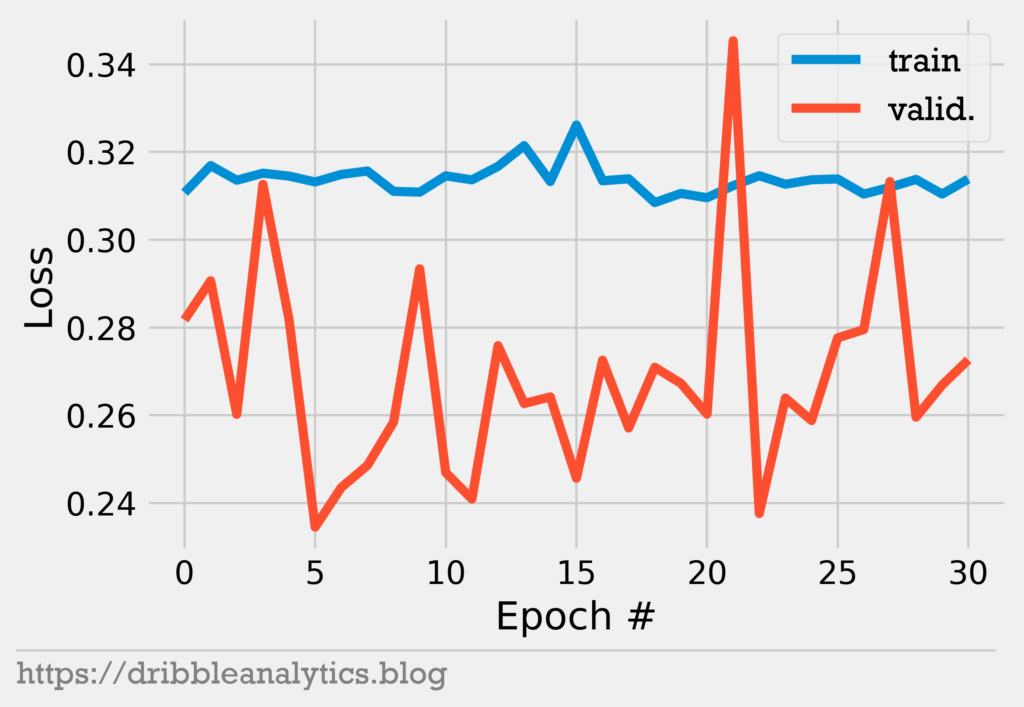
Notice that at epoch 5, our validation loss is minimized. So, the model completes the next 25 epochs (until epoch 30). None of these epochs result in lower validation loss, so the model stops learning and uses the weights from this earlier epoch.
Overfitting: dropout
The final method we’ll use to avoid overfitting is dropout. Dropout occurs when we randomly drop (or ignore) a certain subset of nodes in a layer. This lets us mimic creating a bunch of different neural network structures in a simple way to see which performs best. Each time we drop a unit, we also drop its connections. This causes other units to adjust their weights accordingly.
Like L1 regularization, dropout can make our coefficients sparse, helping us avoid overfitting. After each layer except for the final output layer, we randomly dropped 20% of the nodes.
Model performance
Now that we understand the model’s structure, let’s evaluate its performance. We’ll use some of the usual classification metrics we present, along with some new ones. We create these metrics by comparing our predicted values from the testing set to the real values from the testing set.
Note that a random model would have about 50% accuracy on the testing set. This is because the training set has a true 50/50 split of classes, while the testing set has a large class imbalance. So, high accuracy is indicative of strong performance here.
First, we’ll look at the confusion matrix.
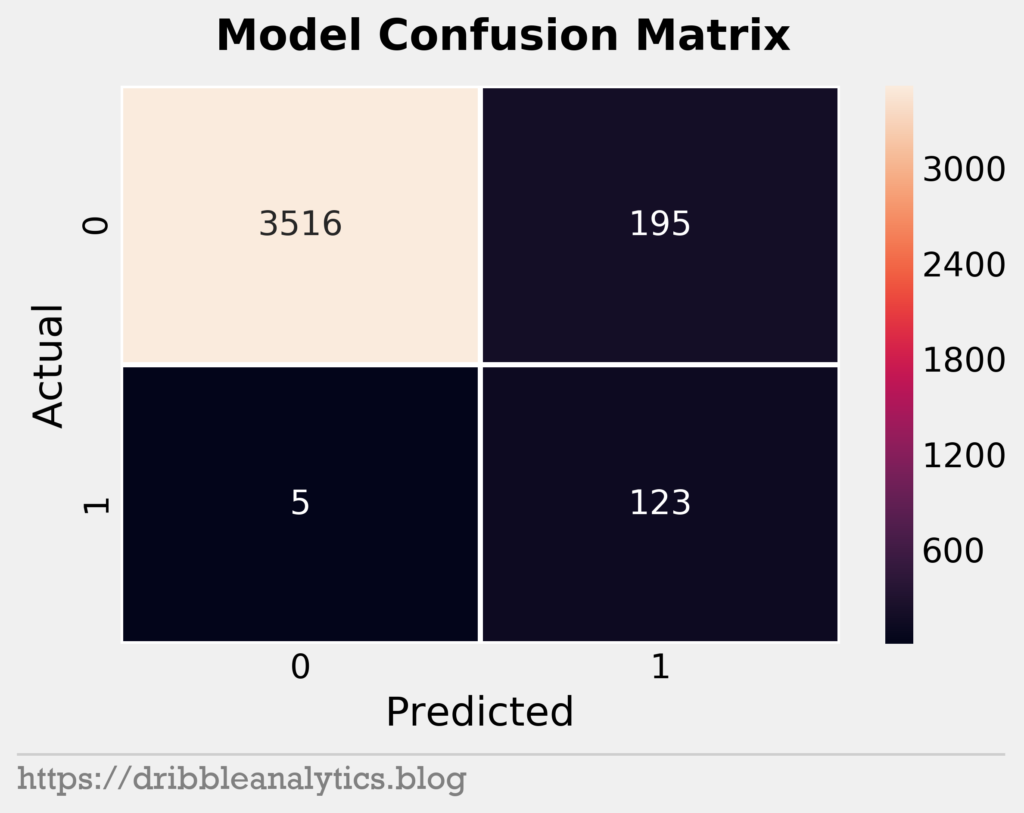
We see that the model has 5 false negatives (predicted 0 but actual 1). This is a great sign, as we’re most interested in finding the All-NBA worthy players. So, over predicting these (having lots of predicted 1s but actual 0s) is better than under predicting them. Therefore, the high number of false positives is not alarming. In fact, it’s expected given that the training data consisted of several synthetic observations of the positive class. Because of the synthetic data, we would expect the model to over-predict the positive class.
We see that the model has accuracy 0.948, recall 0.961, and precision 0.387 (and consequently, F1 0.552). Though the precision is low, we’d prefer high recall and low precision instead of the other way around here.
To create the teams, we use the same method as last year. The player with the highest predicted probability goes into the highest slot in his position. Because we care about prediction probabilities, we’ll look at some probability-focused metrics.
The model has a log loss of 0.120 and a Brier score of 0.039. Both metrics are quite strong. Next, we’ll look at the ROC curve and the area under it.
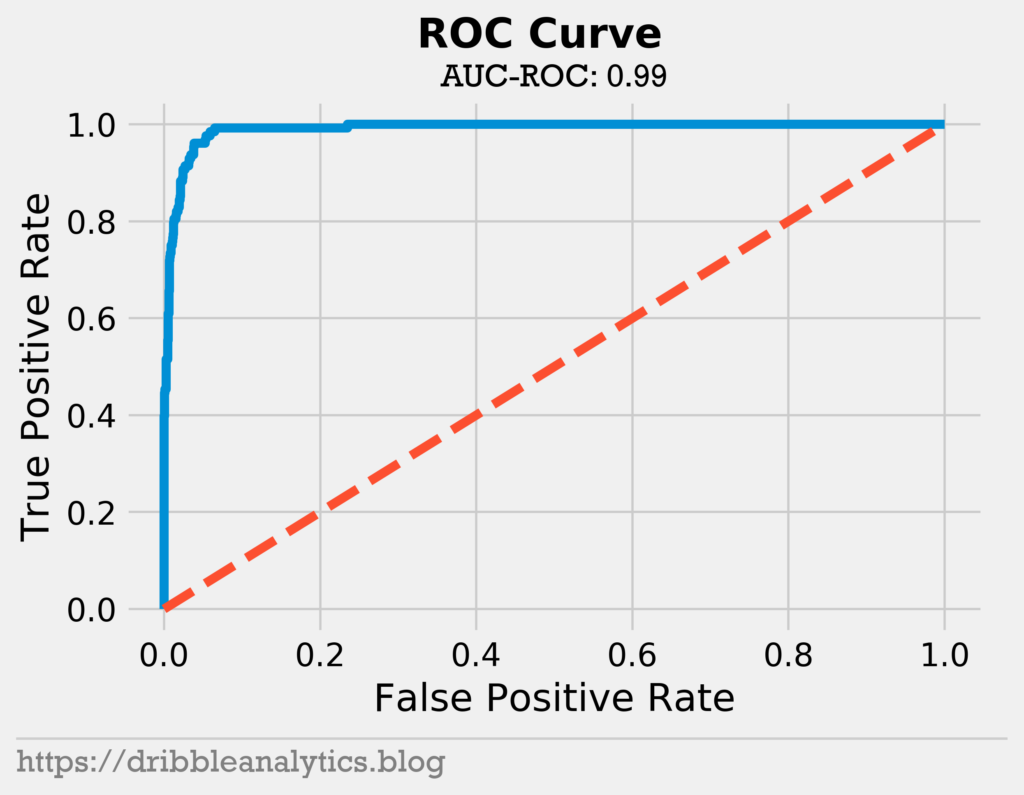
The model has a near-perfect area under the ROC curve of 0.99. This means the model is very strong at differentiating between the two classes.
Finally, we’ll look at 2 additional graphs to show our model’s prediction probability strength. First, we’ll look at the cumulative gain.
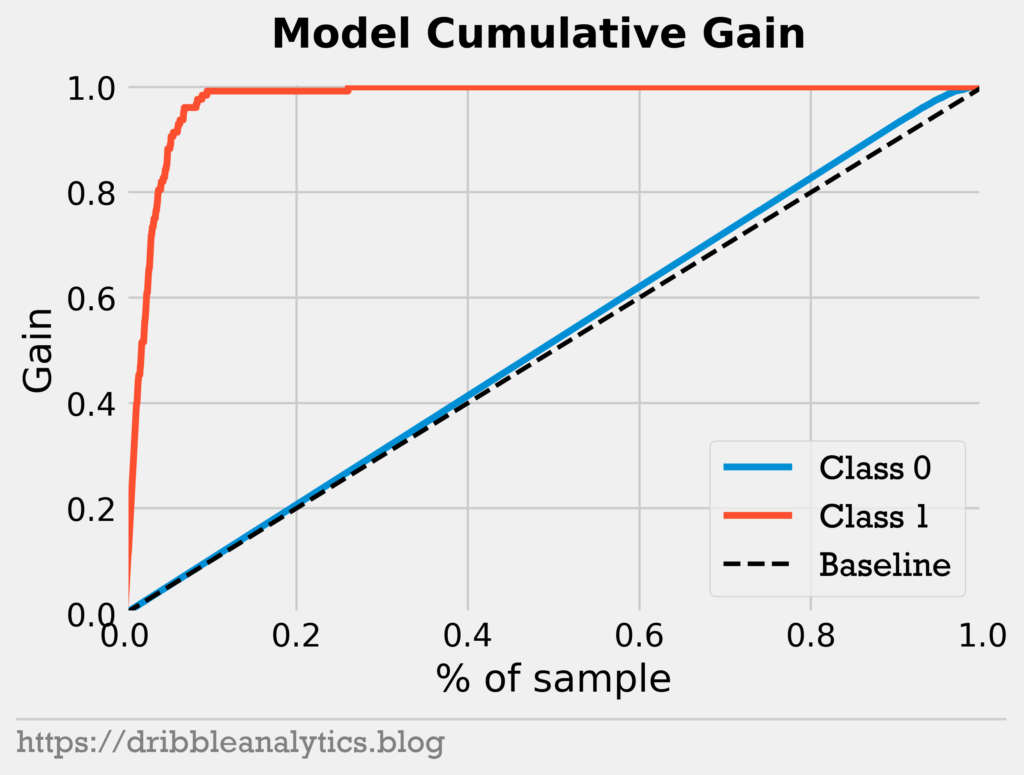
This shows the percentage of the total cases in a class “gained” by targeting a percentage of the total sample. The dotted black line represents the baseline, or essentially what you’d expect from a true random sample. So, any point along the baseline says “the top x% of the sample contains x% of this class.” This means that the higher we are above the baseline, the better the model is at identifying that class.
We see that the cumulative gain for class 1 is very high. By the top 15% of the sample, we contain almost 100% of class 1. Given that class 1 is All-NBA players, it’s very good that the top 15% of players in All-NBA probability is a superset of all All-NBA players. Though the model isn’t very good at identifying class 0 (not All-NBA players) above random, this is not our main concern.
Next, we’ll look at the lift curve. This presents a similar idea in a different way.
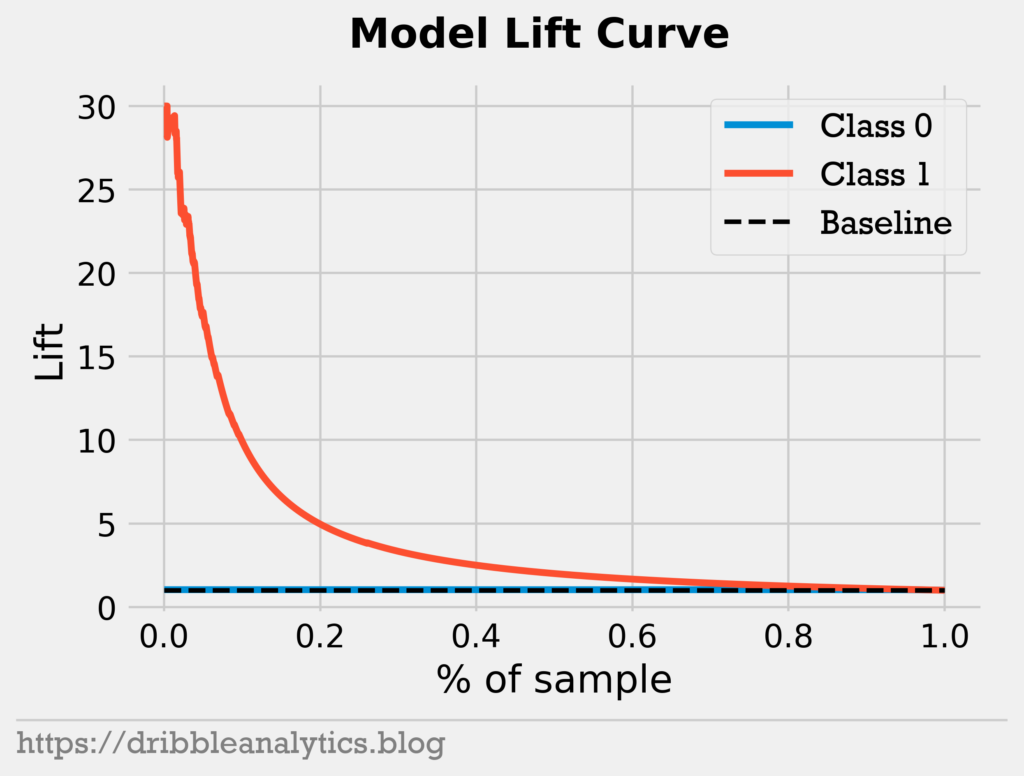
This essentially divides each point on the cumulative gains chart by the baseline. So, the “lift” is the ratio of the cumulative gain to the baseline. For example, at the point (0.2, 5), we see that the model is 5x more likely to identify an All-NBA player in the top 20% of the sample than a random model. Among the highest prediction probabilities, the model is about 30x more likely to identify an All-NBA player than the baseline.
Each of our metrics shows the model’s strength, particularly in predicting the positive class (All-NBA players). We believe the model creates strong predictions for All-NBA players.
Results
On 2/3/2020 before any games were played, we collected all the necessary data for every player who played a game in the 2019-20 All-NBA season. We scaled the necessary stats (like games, win shares, etc.) up to a full season. Then, we fed the model this data to make predictions.
As described before, we created the All-NBA teams with prediction probabilities. When a player’s position was unclear, we used All-Star game position. If the player did not make the All-Star game, we used whichever position the player played the most minutes. So, Luka Doncic counts as a guard. DeMar DeRozan and Jimmy Butler count as forwards.
The table below shows our results.
| Team | G | G | F | F | C |
|---|---|---|---|---|---|
| 1 | James Harden | Damian Lillard | Giannis Antetokounmpo | LeBron James | Anthony Davis |
| 2 | Luka Doncic | Ben Simmons | Jimmy Butler | Kawhi Leonard | Rudy Gobert |
| 3 | Devin Booker | Trae Young | Pascal Siakam | DeMar DeRozan | Nikola Jokic |
To view each player’s probability, look at the table below.
| Player | All-NBA probability |
|---|---|
| James Harden | 0.9480215311050415 |
| Giannis Antetokounmpo | 0.9480148553848267 |
| Anthony Davis | 0.9479857683181763 |
| Damian Lillard | 0.9479836225509644 |
| LeBron James | 0.947951078414917 |
| Luka Doncic | 0.9479497671127319 |
| Jimmy Butler | 0.9478923678398132 |
| Rudy Gobert | 0.9478687644004822 |
| Kawhi Leonard | 0.9478293657302856 |
| Ben Simmons | 0.9477744102478027 |
| Nikola Jokic | 0.9475186467170715 |
| Karl-Anthony Towns | 0.9472841024398804 |
| Bam Adebayo | 0.9470556974411011 |
| Devin Booker | 0.9464844465255737 |
| Joel Embiid | 0.9444474577903748 |
| Domantas Sabonis | 0.9431513547897339 |
| Trae Young | 0.9424223899841309 |
| Kemba Walker | 0.9404627084732056 |
| Kyle Lowry | 0.9393622875213623 |
| Hassan Whiteside | 0.9336522221565247 |
| Khris Middleton | 0.9310164451599121 |
| Fred VanVleet | 0.9268943071365356 |
| Pascal Siakam | 0.922353208065033 |
| Russell Westbrook | 0.9170670509338379 |
| Chris Paul | 0.9143471121788025 |
| DeMar DeRozan | 0.9121332168579102 |
| Donovan Mitchell | 0.8602151274681091 |
| Clint Capela | 0.8315081596374512 |
| Kyrie Irving | 0.829150915145874 |
| Brandon Ingram | 0.8029384613037109 |
| Bradley Beal | 0.7760326862335205 |
| Nikola Vucevic | 0.7025138139724731 |
| Jayson Tatum | 0.6029720306396484 |
| Jaylen Brown | 0.5255657434463501 |
| Paul George | 0.44798198342323303 |
| Gordon Hayward | 0.4315990209579468 |
| Danilo Gallinari | 0.4140489399433136 |
| Eric Bledsoe | 0.3475889563560486 |
| LaMarcus Aldridge | 0.31634461879730225 |
| Tobias Harris | 0.21559995412826538 |
| Zach LaVine | 0.20887699723243713 |
| Malcolm Brogdon | 0.18707752227783203 |
| Andre Drummond | 0.17573970556259155 |
| De'Aaron Fox | 0.14996907114982605 |
| Shai Gilgeous-Alexander | 0.1443256437778473 |
| Steven Adams | 0.14309266209602356 |
| John Collins | 0.12286686897277832 |
| Stephen Curry | 0.10660269856452942 |
| Richaun Holmes | 0.08404144644737244 |
| Jarrett Allen | 0.07887303829193115 |
| Jrue Holiday | 0.07769456505775452 |
| Will Barton | 0.07266959547996521 |
| T.J. Warren | 0.07223466038703918 |
| D'Angelo Russell | 0.06265479326248169 |
| Jamal Murray | 0.060570478439331055 |
| Al Horford | 0.057276129722595215 |
| Zion Williamson | 0.05636218190193176 |
| Bojan Bogdanovic | 0.04099854826927185 |
| Wendell Carter | 0.04053768515586853 |
| Jonas Valanciunas | 0.03906595706939697 |
| Jonathan Isaac | 0.0366000235080719 |
| Kelly Oubre | 0.034963369369506836 |
| Deandre Ayton | 0.028072267770767212 |
| Evan Fournier | 0.027677983045578003 |
| Ricky Rubio | 0.02220931649208069 |
| Ja Morant | 0.021437644958496094 |
| Andrew Wiggins | 0.019577056169509888 |
| Marcus Morris | 0.017286360263824463 |
| Paul Millsap | 0.01654037833213806 |
| Kristaps Porzingis | 0.01575717329978943 |
| CJ McCollum | 0.013874620199203491 |
| Patrick Beverley | 0.012319177389144897 |
| Marc Gasol | 0.011332482099533081 |
| Josh Richardson | 0.009869635105133057 |
| Jeremy Lamb | 0.008057057857513428 |
| Derrick Favors | 0.007891297340393066 |
| Kevin Love | 0.007175415754318237 |
| Daniel Theis | 0.006873130798339844 |
| Myles Turner | 0.0059681236743927 |
| Zach Collins | 0.005391627550125122 |
| Tomas Satoransky | 0.005050539970397949 |
| Luke Kennard | 0.00469401478767395 |
| Brook Lopez | 0.004653066396713257 |
| Dwight Powell | 0.00436052680015564 |
| Otto Porter | 0.0037623047828674316 |
| Reggie Jackson | 0.0031495392322540283 |
| Kendrick Nunn | 0.0030628740787506104 |
| Lauri Markkanen | 0.0029882490634918213 |
| Jaren Jackson | 0.0028879642486572266 |
| Rodney Hood | 0.002882152795791626 |
| Julius Randle | 0.0026159584522247314 |
| OG Anunoby | 0.002580493688583374 |
| Blake Griffin | 0.002436310052871704 |
| JaVale McGee | 0.0024200379848480225 |
| Harrison Barnes | 0.0021103322505950928 |
| Rui Hachimura | 0.0018580853939056396 |
| Nemanja Bjelica | 0.0018393993377685547 |
| Aaron Gordon | 0.001834958791732788 |
| Terry Rozier | 0.0016864240169525146 |
| Carmelo Anthony | 0.0013953745365142822 |
| Marques Bolden | 0.0013028383255004883 |
| Gary Harris | 0.001286238431930542 |
| Tristan Thompson | 0.001275777816772461 |
| Ivica Zubac | 0.0012688494753092527 |
| Joe Harris | 0.0011789202690124512 |
| P.J. Tucker | 0.0011532902717590332 |
| Draymond Green | 0.0011351406574249268 |
| Talen Horton-Tucker | 0.0011055171489715576 |
| Victor Oladipo | 0.0009457767009735107 |
| Thomas Bryant | 0.0007428228855133057 |
| Robert Covington | 0.0006920397281646729 |
| Eric Mika | 0.000676274299621582 |
| Josh Jackson | 0.0006466209888458252 |
| P.J. Washington | 0.0006004869937896729 |
| Dorian Finney-Smith | 0.000508725643157959 |
| Justise Winslow | 0.0005022585391998291 |
| Collin Sexton | 0.0005015730857849121 |
| Matt Mooney | 0.00046500563621520996 |
| Glenn Robinson | 0.00041490793228149414 |
| Danny Green | 0.0003979504108428955 |
| Spencer Dinwiddie | 0.00031563639640808105 |
| Naz Mitrou-Long | 0.0002961158752441406 |
| Marvin Bagley | 0.0002734065055847168 |
| Marcus Smart | 0.00026682019233703613 |
| Reggie Bullock | 0.00024819374084472656 |
| Royce O'Neale | 0.0002320706844329834 |
| Duncan Robinson | 0.0002116560935974121 |
| Wesley Matthews | 0.00021076202392578125 |
| Jae Crowder | 0.0001970529556274414 |
| Dion Waiters | 0.00019669532775878906 |
| Buddy Hield | 0.0001939237117767334 |
| Mike Conley | 0.00019115209579467773 |
| Ian Mahinmi | 0.00017258524894714355 |
| Dillon Brooks | 0.00016617774963378906 |
| Ryan Anderson | 0.00011214613914489746 |
| Devonte' Graham | 0.00010818243026733398 |
| Markelle Fultz | 0.0001055300235748291 |
| J.J. Redick | 0.0001004934310913086 |
| Willie Cauley-Stein | 8.52346420288086e-05 |
| Josh Gray | 7.703900337219238e-05 |
| Frank Mason | 7.477402687072754e-05 |
| Jabari Parker | 6.115436553955078e-05 |
| Meyers Leonard | 6.115436553955078e-05 |
| Taurean Prince | 5.650520324707031e-05 |
| Aron Baynes | 5.59687614440918e-05 |
| Jarrell Brantley | 5.117058753967285e-05 |
| RJ Barrett | 4.9740076065063477e-05 |
| Elfrid Payton | 4.9620866775512695e-05 |
| Max Strus | 4.8547983169555664e-05 |
| DaQuan Jeffries | 4.4286251068115234e-05 |
| Jeremiah Martin | 4.2438507080078125e-05 |
| Cedi Osman | 3.981590270996094e-05 |
| Gary Payton | 3.793835639953613e-05 |
| Miles Bridges | 3.7789344787597656e-05 |
| Tony Snell | 3.6269426345825195e-05 |
| Udonis Haslem | 3.457069396972656e-05 |
| Dejounte Murray | 3.427267074584961e-05 |
| Terrance Ferguson | 3.349781036376953e-05 |
| J.J. Barea | 2.9593706130981445e-05 |
| Brian Bowen | 2.9087066650390625e-05 |
| Paul Watson | 2.8967857360839844e-05 |
| Justin Anderson | 2.79843807220459e-05 |
| Miye Oni | 2.7865171432495117e-05 |
| Landry Shamet | 2.7805566787719727e-05 |
| Lonzo Ball | 2.7120113372802734e-05 |
| Tremont Waters | 2.60770320892334e-05 |
| Amir Coffey | 2.1338462829589844e-05 |
| PJ Dozier | 1.9878149032592773e-05 |
| Khyri Thomas | 1.9848346710205078e-05 |
| Daryl Macon | 1.9341707229614258e-05 |
| Zylan Cheatham | 1.8894672393798828e-05 |
| Isaiah Roby | 1.8537044525146484e-05 |
| Henry Ellenson | 1.8298625946044922e-05 |
| Dario Saric | 1.77919864654541e-05 |
| Adam Mokoka | 1.728534698486328e-05 |
| Vic Law | 1.659989356994629e-05 |
| Jalen McDaniels | 1.5914440155029297e-05 |
| Luguentz Dort | 1.519918441772461e-05 |
| Stanton Kidd | 1.4662742614746094e-05 |
| Zhaire Smith | 1.3679265975952148e-05 |
| Jared Harper | 1.290440559387207e-05 |
| Danuel House | 1.2576580047607422e-05 |
| Dragan Bender | 1.2308359146118164e-05 |
| Kevin Huerter | 1.2010335922241211e-05 |
| Johnathan Motley | 1.1563301086425781e-05 |
| Caleb Martin | 1.138448715209961e-05 |
| Johnathan Williams | 1.099705696105957e-05 |
| Keldon Johnson | 1.0520219802856445e-05 |
| Avery Bradley | 1.0460615158081055e-05 |
| Chandler Parsons | 1.0013580322265625e-05 |
| Tacko Fall | 9.179115295410156e-06 |
| Kadeem Allen | 9.08970832824707e-06 |
| Jaylen Nowell | 9.03010368347168e-06 |
| Zach Norvell | 8.702278137207031e-06 |
| John Konchar | 7.748603820800781e-06 |
| Michael Frazier | 7.539987564086914e-06 |
| Kyle Guy | 7.3909759521484375e-06 |
| Jalen Lecque | 7.3909759521484375e-06 |
| Justin Patton | 7.12275505065918e-06 |
| Josh Magette | 7.0035457611083984e-06 |
| Alen Smailagic | 6.8247318267822266e-06 |
| B.J. Johnson | 6.377696990966797e-06 |
| Norman Powell | 6.318092346191406e-06 |
| Bryn Forbes | 6.22868537902832e-06 |
| Dewan Hernandez | 6.020069122314453e-06 |
| Isaiah Thomas | 5.662441253662109e-06 |
| Devon Hall | 5.602836608886719e-06 |
| Shamorie Ponds | 5.334615707397461e-06 |
| Kostas Antetokounmpo | 5.304813385009766e-06 |
| De'Andre Hunter | 5.066394805908203e-06 |
| Tim Hardaway | 5.0067901611328125e-06 |
| Bruce Brown | 4.589557647705078e-06 |
| Jake Layman | 4.589557647705078e-06 |
| Yuta Watanabe | 4.559755325317383e-06 |
| Damion Lee | 4.500150680541992e-06 |
| C.J. Miles | 4.112720489501953e-06 |
| Louis King | 3.6954879760742188e-06 |
| Jordan Bone | 3.6656856536865234e-06 |
| JaKarr Sampson | 3.6656856536865234e-06 |
| Joe Ingles | 3.635883331298828e-06 |
| KZ Okpala | 3.039836883544922e-06 |
| Antonius Cleveland | 2.9206275939941406e-06 |
| Vlatko Cancar | 2.7120113372802734e-06 |
| Kevin Hervey | 2.562999725341797e-06 |
| Sekou Doumbouya | 2.562999725341797e-06 |
| Courtney Lee | 2.5033950805664062e-06 |
| Taj Gibson | 2.384185791015625e-06 |
| Shabazz Napier | 2.2351741790771484e-06 |
| Gabe Vincent | 2.205371856689453e-06 |
| Kevon Looney | 2.175569534301758e-06 |
| Cristiano Felicio | 2.115964889526367e-06 |
| Serge Ibaka | 2.115964889526367e-06 |
| Jonah Bolden | 1.9669532775878906e-06 |
| Nigel Williams-Goss | 1.9669532775878906e-06 |
| Charlie Brown | 1.6689300537109375e-06 |
| Drew Eubanks | 1.4901161193847656e-06 |
| Eric Gordon | 1.3113021850585938e-06 |
| Josh Reaves | 1.2218952178955078e-06 |
| Justin Robinson | 1.2218952178955078e-06 |
| Chris Chiozza | 1.2218952178955078e-06 |
| Khem Birch | 1.1920928955078125e-06 |
| Dean Wade | 1.1920928955078125e-06 |
| Patrick McCaw | 1.1026859283447266e-06 |
| Caris LeVert | 1.1026859283447266e-06 |
| Garrett Temple | 1.0728836059570312e-06 |
| Shake Milton | 1.043081283569336e-06 |
| Jordan McLaughlin | 1.0132789611816406e-06 |
| Moritz Wagner | 1.0132789611816406e-06 |
| Jarred Vanderbilt | 9.238719940185547e-07 |
| Mfiondu Kabengele | 7.748603820800781e-07 |
| Michael Kidd-Gilchrist | 6.854534149169922e-07 |
| Cody Zeller | 6.258487701416016e-07 |
| Maurice Harkless | 6.258487701416016e-07 |
| Nicolas Claxton | 5.960464477539062e-07 |
| Moses Brown | 5.662441253662109e-07 |
| Ryan Broekhoff | 5.662441253662109e-07 |
| Darius Garland | 5.662441253662109e-07 |
| Jahlil Okafor | 5.066394805908203e-07 |
| Ignas Brazdeikis | 4.76837158203125e-07 |
| Kris Dunn | 4.470348358154297e-07 |
| Donte DiVincenzo | 4.172325134277344e-07 |
| Iman Shumpert | 3.8743019104003906e-07 |
| Jaylen Hoard | 3.5762786865234375e-07 |
| Frank Kaminsky | 2.980232238769531e-07 |
| Norvel Pelle | 2.980232238769531e-07 |
| Juwan Morgan | 2.682209014892578e-07 |
| Caleb Swanigan | 2.384185791015625e-07 |
| Naz Reid | 2.086162567138672e-07 |
| Garrison Mathews | 2.086162567138672e-07 |
| Tyler Cook | 2.086162567138672e-07 |
| Chandler Hutchison | 2.086162567138672e-07 |
| Al-Farouq Aminu | 2.086162567138672e-07 |
| Alize Johnson | 2.086162567138672e-07 |
| Bismack Biyombo | 2.086162567138672e-07 |
| Robert Williams | 1.7881393432617188e-07 |
| Rayjon Tucker | 1.7881393432617188e-07 |
| Tim Frazier | 1.4901161193847656e-07 |
| Chimezie Metu | 1.4901161193847656e-07 |
| Brandon Goodwin | 1.1920928955078125e-07 |
| Brandon Knight | 1.1920928955078125e-07 |
| Romeo Langford | 1.1920928955078125e-07 |
| Ante Zizic | 1.1920928955078125e-07 |
| Nicolas Batum | 8.940696716308594e-08 |
| Derrick Rose | 8.940696716308594e-08 |
| James Johnson | 8.940696716308594e-08 |
| Tyrone Wallace | 8.940696716308594e-08 |
| Ty Jerome | 8.940696716308594e-08 |
| Thanasis Antetokounmpo | 8.940696716308594e-08 |
| Melvin Frazier | 8.940696716308594e-08 |
| Vincent Poirier | 8.940696716308594e-08 |
| Isaac Bonga | 5.960464477539063e-08 |
| Evan Turner | 5.960464477539063e-08 |
| Isaiah Hartenstein | 5.960464477539063e-08 |
| Wenyen Gabriel | 5.960464477539063e-08 |
| Trey Lyles | 5.960464477539063e-08 |
| Edmond Sumner | 5.960464477539063e-08 |
| Harry Giles | 5.960464477539063e-08 |
| Jeff Teague | 2.9802322387695312e-08 |
| Alec Burks | 2.9802322387695312e-08 |
| Wilson Chandler | 2.9802322387695312e-08 |
| Allonzo Trier | 2.9802322387695312e-08 |
| Kyle O'Quinn | 2.9802322387695312e-08 |
| David Nwaba | 2.9802322387695312e-08 |
| Kelan Martin | 2.9802322387695312e-08 |
| DeMarre Carroll | 2.9802322387695312e-08 |
| Kenrich Williams | 2.9802322387695312e-08 |
| Jarrett Culver | 2.9802322387695312e-08 |
| Mason Plumlee | 0.0 |
| Theo Pinson | 0.0 |
| Dwayne Bacon | 0.0 |
| Jakob Poeltl | 0.0 |
| Anfernee Simons | 0.0 |
| Mo Bamba | 0.0 |
| Coby White | 0.0 |
| Matisse Thybulle | 0.0 |
| Grant Williams | 0.0 |
| Chris Silva | 0.0 |
| Marvin Williams | 0.0 |
| Ish Smith | 0.0 |
| Derrick White | 0.0 |
| Christian Wood | 0.0 |
| Trevor Ariza | 0.0 |
| Patrick Patterson | 0.0 |
| Anzejs Pasecniks | 0.0 |
| Eric Paschall | 0.0 |
| Matt Thomas | 0.0 |
| Omari Spellman | 0.0 |
| Ryan Arcidiacono | 0.0 |
| Noah Vonleh | 0.0 |
| D.J. Wilson | 0.0 |
| Grayson Allen | 0.0 |
| Davis Bertans | 0.0 |
| Jordan Poole | 0.0 |
| Thabo Sefolosha | 0.0 |
| Kevin Porter | 0.0 |
| Delon Wright | 0.0 |
| Lou Williams | 0.0 |
| Jerome Robinson | 0.0 |
| Gary Trent | 0.0 |
| Thaddeus Young | 0.0 |
| Austin Rivers | 0.0 |
| Mitchell Robinson | 0.0 |
| Darius Bazley | 0.0 |
| Brad Wanamaker | 0.0 |
| Denzel Valentine | 0.0 |
| Derrick Walton | 0.0 |
| Rajon Rondo | 0.0 |
| Terrence Ross | 0.0 |
| D.J. Augustin | 0.0 |
| Kyle Anderson | 0.0 |
| Kent Bazemore | 0.0 |
| Cam Reddish | 0.0 |
| Malik Beasley | 0.0 |
| Lonnie Walker | 0.0 |
| Marco Belinelli | 0.0 |
| Jordan Bell | 0.0 |
| Bobby Portis | 0.0 |
| Keita Bates-Diop | 0.0 |
| Nickeil Alexander-Walker | 0.0 |
| Admiral Schofield | 0.0 |
| DeAndre' Bembry | 0.0 |
| Michael Porter | 0.0 |
| Anthony Tolliver | 0.0 |
| Dennis Schroder | 0.0 |
| Mike Scott | 0.0 |
| Dennis Smith | 0.0 |
| Ky Bowman | 0.0 |
| Kelly Olynyk | 0.0 |
| Alex Caruso | 0.0 |
| Treveon Graham | 0.0 |
| Jerami Grant | 0.0 |
| JaMychal Green | 0.0 |
| Javonte Green | 0.0 |
| Jeff Green | 0.0 |
| Vince Carter | 0.0 |
| Marko Guduric | 0.0 |
| Jevon Carter | 0.0 |
| Montrezl Harrell | 0.0 |
| Kentavious Caldwell-Pope | 0.0 |
| Shaquille Harrison | 0.0 |
| Josh Hart | 0.0 |
| Jaxson Hayes | 0.0 |
| Bruno Caboclo | 0.0 |
| John Henson | 0.0 |
| Juancho Hernangomez | 0.0 |
| Willy Hernangomez | 0.0 |
| Tyler Herro | 0.0 |
| Mario Hezonja | 0.0 |
| George Hill | 0.0 |
| Solomon Hill | 0.0 |
| Aaron Holiday | 0.0 |
| Deonte Burton | 0.0 |
| Justin Holiday | 0.0 |
| Rondae Hollis-Jefferson | 0.0 |
| Trey Burke | 0.0 |
| Dwight Howard | 0.0 |
| Ersan Ilyasova | 0.0 |
| Jalen Brunson | 0.0 |
| Michael Carter-Williams | 0.0 |
| Tyson Chandler | 0.0 |
| Josh Okogie | 0.0 |
| Rudy Gay | 0.0 |
| Quinn Cook | 0.0 |
| Allen Crabbe | 0.0 |
| Torrey Craig | 0.0 |
| Seth Curry | 0.0 |
| Troy Daniels | 0.0 |
| Ed Davis | 0.0 |
| Terence Davis | 0.0 |
| Dewayne Dedmon | 0.0 |
| Matthew Dellavedova | 0.0 |
| Chris Clemons | 0.0 |
| Cheick Diallo | 0.0 |
| Hamidou Diallo | 0.0 |
| Gorgui Dieng | 0.0 |
| Damyean Dotson | 0.0 |
| Goran Dragic | 0.0 |
| Jordan Clarkson | 0.0 |
| Jared Dudley | 0.0 |
| Carsen Edwards | 0.0 |
| Wayne Ellington | 0.0 |
| Brandon Clarke | 0.0 |
| James Ennis | 0.0 |
| Jacob Evans | 0.0 |
| Dante Exum | 0.0 |
| Gary Clark | 0.0 |
| Bruno Fernando | 0.0 |
| Yogi Ferrell | 0.0 |
| Marquese Chriss | 0.0 |
| Daniel Gafford | 0.0 |
| Langston Galloway | 0.0 |
| Troy Brown | 0.0 |
| Wes Iwundu | 0.0 |
| Frank Jackson | 0.0 |
| Sterling Brown | 0.0 |
| T.J. McConnell | 0.0 |
| Doug McDermott | 0.0 |
| Chris Boucher | 0.0 |
| Rodney McGruder | 0.0 |
| Alfonzo McKinnie | 0.0 |
| Ben McLemore | 0.0 |
| Jordan McRae | 0.0 |
| Nicolo Melli | 0.0 |
| De'Anthony Melton | 0.0 |
| Malcolm Miller | 0.0 |
| Patty Mills | 0.0 |
| Malik Monk | 0.0 |
| E'Twaun Moore | 0.0 |
| Bogdan Bogdanovic | 0.0 |
| Markieff Morris | 0.0 |
| Monte Morris | 0.0 |
| Emmanuel Mudiay | 0.0 |
| Goga Bitadze | 0.0 |
| Dzanan Musa | 0.0 |
| Mike Muscala | 0.0 |
| Svi Mykhailiuk | 0.0 |
| Abdel Nader | 0.0 |
| Larry Nance | 0.0 |
| Raul Neto | 0.0 |
| Georges Niang | 0.0 |
| Nerlens Noel | 0.0 |
| Frank Ntilikina | 0.0 |
| Semi Ojeleye | 0.0 |
| Elie Okobo | 0.0 |
| Cody Martin | 0.0 |
| Pat Connaughton | 0.0 |
| Boban Marjanovic | 0.0 |
| Furkan Korkmaz | 0.0 |
| Justin Jackson | 0.0 |
| Justin James | 0.0 |
| Amile Jefferson | 0.0 |
| Cameron Johnson | 0.0 |
| Stanley Johnson | 0.0 |
| Damian Jones | 0.0 |
| Derrick Jones | 0.0 |
| Tyus Jones | 0.0 |
| DeAndre Jordan | 0.0 |
| Cory Joseph | 0.0 |
| Enes Kanter | 0.0 |
| Maxi Kleber | 0.0 |
| Kevin Knox | 0.0 |
| Luke Kornet | 0.0 |
| Terance Mann | 0.0 |
| Kyle Korver | 0.0 |
| Rodions Kurucs | 0.0 |
| Kyle Kuzma | 0.0 |
| Skal Labissiere | 0.0 |
| Oshae Brissett | 0.0 |
| T.J. Leaf | 0.0 |
| Alex Len | 0.0 |
| Mikal Bridges | 0.0 |
| Nassir Little | 0.0 |
| Robin Lopez | 0.0 |
| Tony Bradley | 0.0 |
| Timothe Luwawu-Cabarrot | 0.0 |
| Thon Maker | 0.0 |
| Tyler Johnson | 0.0 |
We see that several players have small differences in their All-NBA probabilities. This will likely stabilize as the season progresses.
Conclusion
Last year, our models almost perfectly predicted the All-NBA teams. This year, we’re taking a different – and hopefully better – approach. So far, our models return what many project for the All-NBA teams.
To improve the model, we could take a few different steps. First, several players have extremely close All-NBA probabilities. This is due to how we constructed the problem. For example, using SMOTE gives us more positive class examples, but it means that the All-NBA worthy players all have high probabilities. Furthermore, different model structures – such as using different numbers of layers, regularization, or activation functions – may help this. Nevertheless, the model’s historical performance is extremely strong. Therefore, it is likely a robust predictor of this year’s All-NBA teams.