Introduction
As soon as free agency opened in July of 2016, the Lakers signed Timofey Mozgov to a 4 year, $64 million deal. At the time, this seemed like an enormous overpay. Today, it still seems like one. In the 2015-16 season, Mozgov averaged 6.3 PPG and 4.4 TRB in 17.4 MPG for the Cavs. The following season – his first as a Laker – his stats improved marginally. He averaged 7.4 PPG and 4.9 TRB in 20.4 MPG.
The following summer, the Lakers dumped Mozgov’s salary. They traded him along with D’Angelo Russell for Brook Lopez and the 27th pick in the draft. They used this pick to select Kyle Kuzma.
Mozgov’s contract was bad from the beginning. But, this is not always the case. Often, misfortune and other unforeseen circumstances make contracts bad. Key examples include injuries and accelerated aging. So, at the time, these contracts seem fine. But they become poison fast. In turn, the players earn much more than expected given their performance.
To find the best and worst value contracts, we’ll create 4 models to predict a player’s salary. This is not a predictive metric of what a player will earn in their next contract. This evaluates expected salary relative to real salary to see who’s overpaid and who’s underpaid.
History and understanding the data
In the 1984-1985 season, the NBA instituted the salary cap. This was a bare-bones salary cap; many of the rules that influence today’s cap weren’t in place. Unrestricted free agency, rookie contracts, max contracts, etc. only came into play later.
With the salary cap, each team had to decide how to allocate their money. Early on, many teams opted for a smooth approach where they would pay lots of middling players. In the 1990-1991 season, only 9 players earned over 20% of the total salary cap. The highest-paid player was Patrick Ewing, who earned 35.8% of the salary cap. At the time, the max contract did not yet exist. This year is somewhat of an outlier. The following season, the salary distribution changed to resemble what we see today.
Larry Bird earned a staggering 56% of the Celtics’ salary cap in the 1991-1992 season. Several players started to earn more of their team’s cap, as the league shifted more towards star power. The CBA only included the max contract about a decade later. Without max contracts, Michael Jordan earned 120% of the cap for two years in his second 3-peat.
Today, due to exceptions and restrictions, teams structure their cap room to get stars. Most contending teams often have a few max players, a couple guys in the $10 million range, and lots of minimums. So, if we’re going to predict salary, we must first understand its distribution.
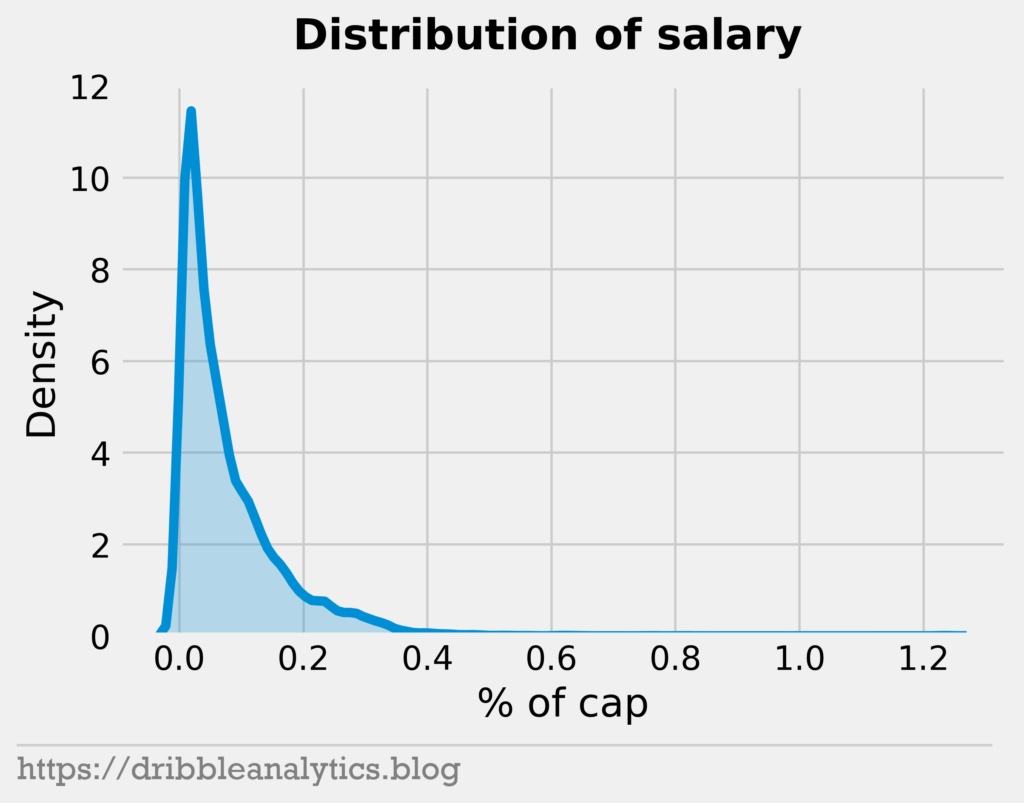
We see that, historically, most players earned a small percentage of the cap. This is what we would expect. With the prevalence of tanking and salary dumps, most teams will have at least one high salary guy. For a contender, this is their main star. For a tanking team, this could be someone they took on along with a draft pick (such as Melo on the Hawks).
Next, we’ll look at how different factors correlate with salary. Theoretically, better players should always earn higher salaries. So, the correlation between something like points and salary should be positive. This is because better scorers are often better players, and, in turn, should earn more.
The CBA complicates this simple relationship with the rookie scale and minimum contracts. If we’re looking at performance relative to salary, rookie contracts by far the best value in the league. Luka Doncic is playing at an incredible level, but only earns about $7.5 million. Minimum contracts create a similar effect of underpaid players. Many contenders have no cap room. So, if a player wants to contend, he must take a pay cut. For the player to join the contender, they must either take a minimum or the mid-level exception (like Cousins on the Warriors). Relative to their performance, this is a steal.
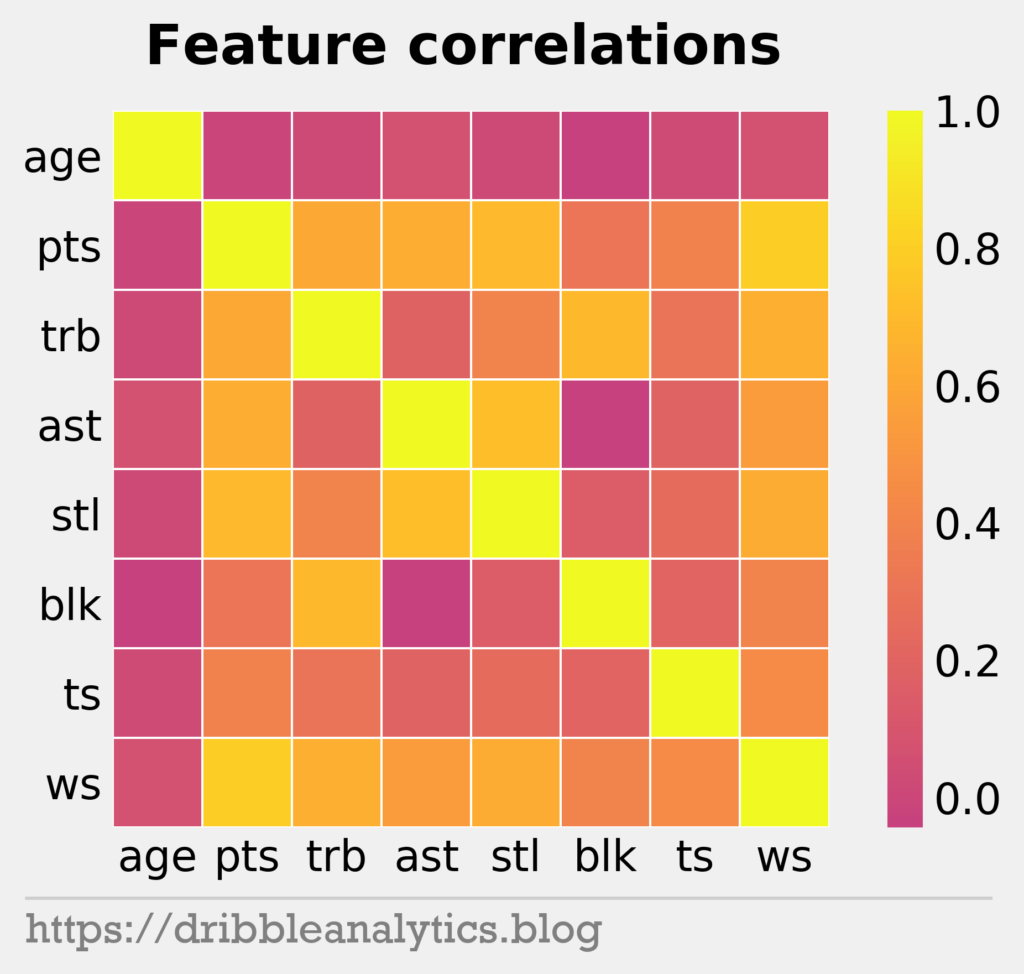
The three graphs below show the relationship between different stats and salary.
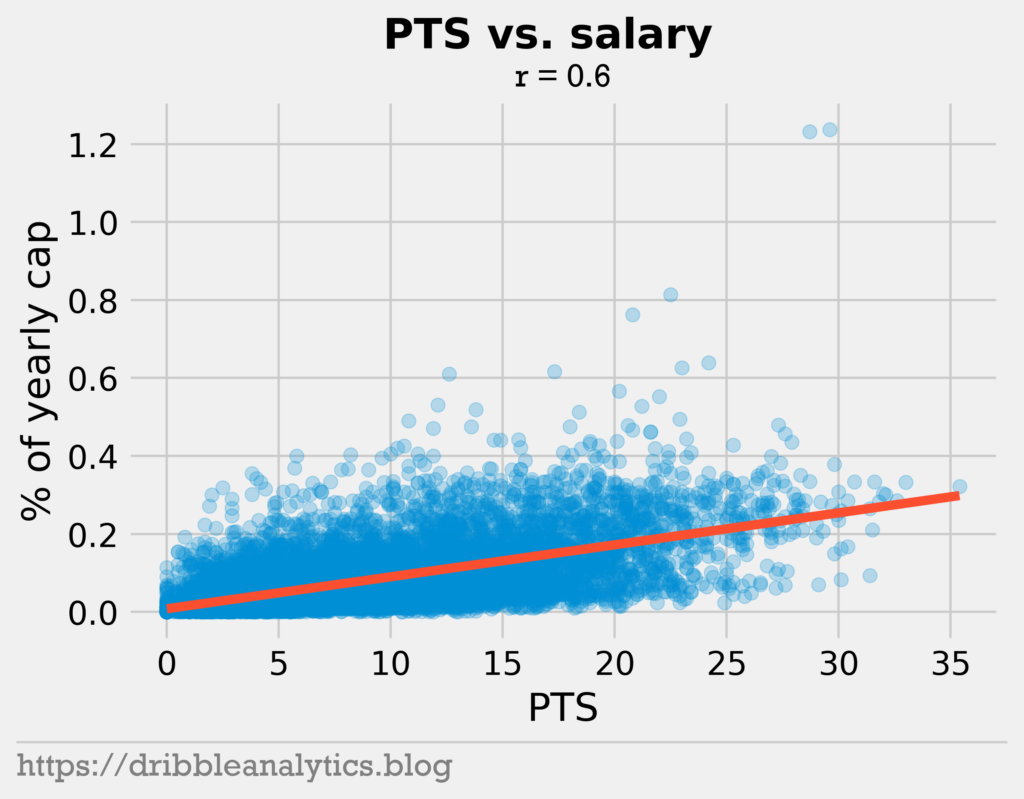
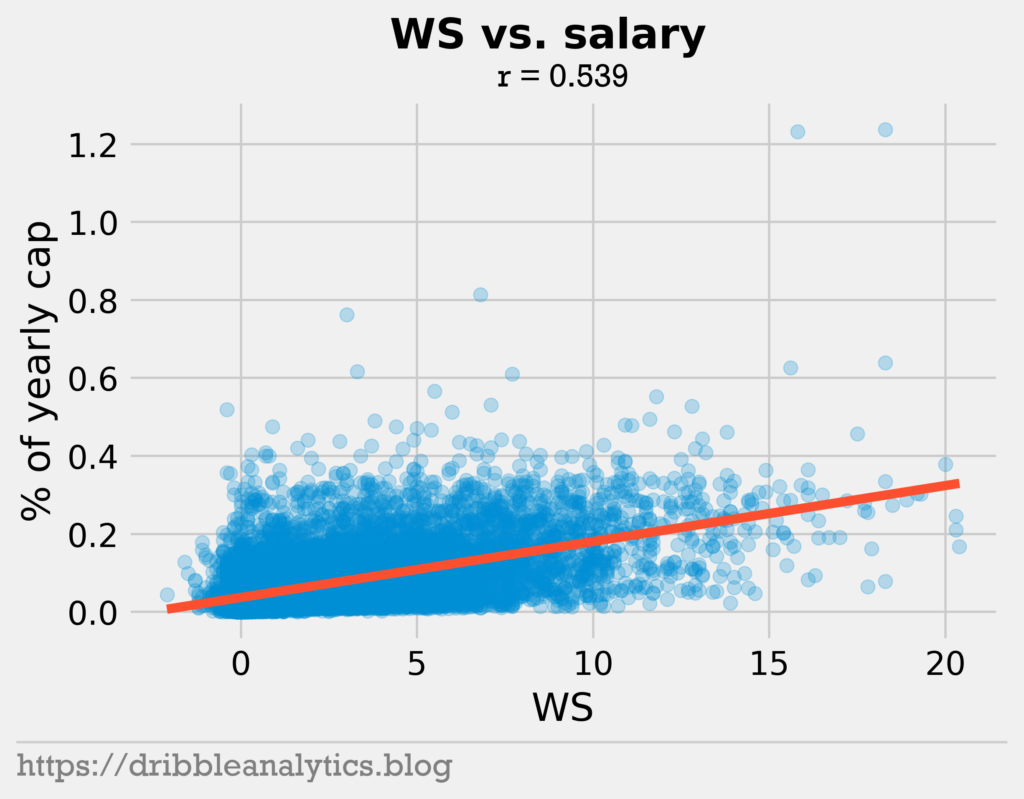
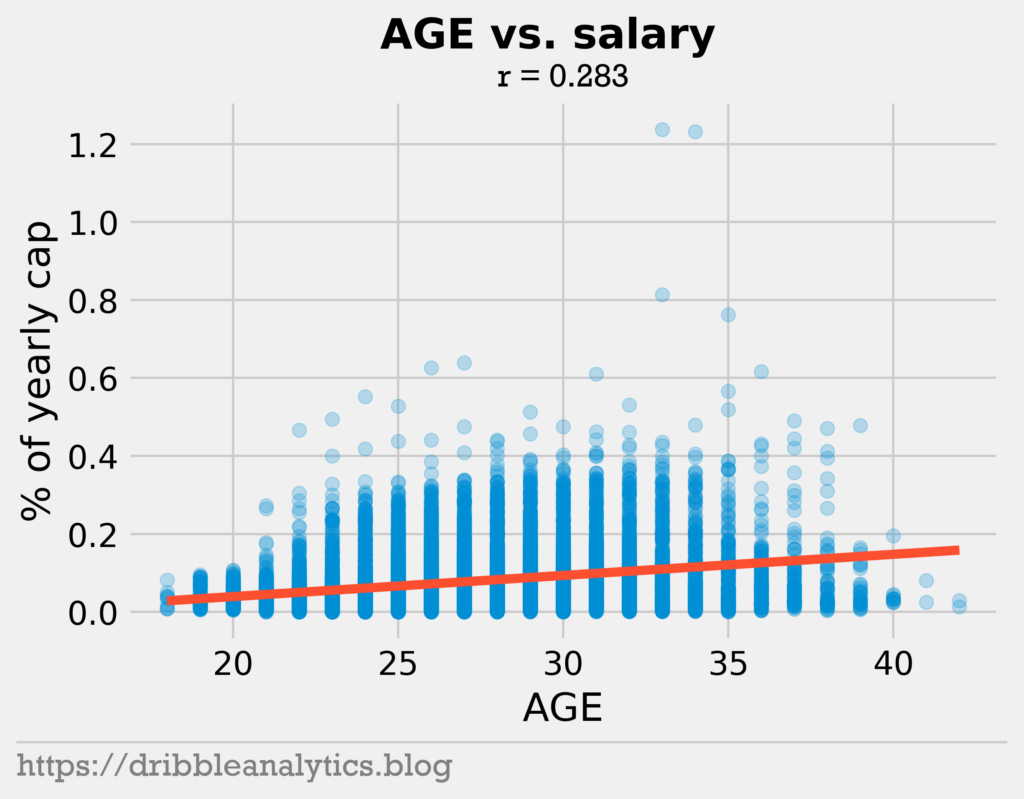
As expected, points and win shares correlate with salary. Furthermore, the age plot shows the effect of rookie contracts. No player under 20 years old earned over 20% of the cap.
Now that we understand the data, we can discuss the methods for the analysis.
Methods
First, we collected all player data for every season since the 1990-1991 season. We go back to 1990-1991 for two reasons. First, the CBA only added unrestricted free agency in 1988. This changed the whole process of free agency – and in turn, contracts. So, we wouldn’t go back further than 1988 anyway. Second, our source for historical player salary data is this Kaggle data set, which only goes back to 1990.
We combined the salary data with each player’s counting and advanced stats for that season. Note that we’re taking stats for the given season. So, this is not a predictive metric. This evaluates whether the player is overpaid or underpaid given their expected salary. As such, players like Gordon Hayward will appear overvalued. At the time, the contract was fair. Due to a devastating injury later, Hayward spent a full year rehabbing and still had to shake off rust. Last season, Hayward did not play like a max player. So, he was overpaid for that season.
We used the following factors to predict a player’s salary:
- Age
- Points per game
- Rebounds per game
- Assists per game
- Steals per game
- Blocks per game
- True shooting %
- Win shares
These factors generally paint a picture of a player’s performance and situation. So, they can predict a player’s salary.
We included age as a feature to adjust for rookie contracts. Though they’re great value, it’s not a result of any negotiation or offer by the GM. It’s based on the player’s draft slot. So, even a superstar 18-year-old can’t get paid a large part of the cap. Adding age nullifies the effect of rookie contracts. If we did not have age, we would likely have to remove rookie contracts, as they would add noise to our data set. This transforms the problem from salary given performance to salary given expected salary. Our definition of expected salary mixes performance and age.
We used win shares instead of VORP or BPM because win shares is a cumulative stat. So, it depends on games played, which is a key factor in how much value a player provides to his team.
To understand the relationship between these features, we created a correlation plot.
With our 10,821 samples, we randomly split the data. We used 75% to train the models, and 25% to test them. We created four models:
- K-nearest neighbors regressor (KNN)
- Random forest regressor (RF)
- Gradient boosting regressor (GBR)
- Extreme gradient boosting regressor (XGB)
Note that we’re predicting the percentage of the cap a player deserves, instead of their raw salary. The salary cap rose and inflation occurred, so players today earn more than players 20 years ago. But, the percentage of the cap stayed consistent. Because we’re predicting percentage of cap, this is a regression problem.
We predicted salary for the 2018-19 season using 2018-19 stats (last season’s numbers). So, contracts won’t exactly match up with what they are today.
We also only considered players who played in the 2018-19 season. This affects some teams; for example, the Heat paid Chris Bosh $26.8 million last season, but he did not play. Because Bosh didn’t play, he’s excluded from the data. Also, Bosh doesn’t count against the Heat’s cap because he retired for medical reasons.
One final note about the data is that there are small inconsistencies due to player movement. We collected contract data from Basketball Reference’s contract page from April 1, 2019 (link). This is after the trade deadline. So, traded players count against the team they played for at the end of the season (e.g. Marc Gasol is on the Raptors, not the Grizzlies). Some players had multiple entries on the page, like Carmelo Anthony. He earned $25 million from the Hawks (salary dump from the Thunder). Then, after the Hawks waived him, Melo signed with the Rockets for $2 million. The Rockets then traded him to the Bulls. So, Melo has a $25 million Hawks entry and a $2 million Bulls entry. We removed duplicates and kept the first-indexed one (the higher salary one).
Neither of these inconsistencies affect the analysis much. Traded players still have the same contract, so on a player-by-player basis for value, they’re the same. This only affects the team’s sum of expected and observed salary difference. In the case of Melo with two entries, there are very few of these cases where it doesn’t matter much.
Regression analysis
In this section, we’ll check how our models perform.
Basic goodness of fit
For regression models, we have two basic metrics of performance. First, we have r-squared. This measures the proportion of the variance in the dependent variable (percent of cap) explained by the independent variables (features). It’s between 0 and 1, with 1 being the best possible value.
Second, we have mean squared error. This measures the average squared difference between the predicted and observed values. Unlike r-squared, lower MSE is better, with a best possible value of 0. We can interpret mean squared error, as it tells us how close our predictions are to the real value on average.
The table below shows the r-squared and mean squared error for the four models.
| Model | r-squared | MSE |
|---|---|---|
| KNN | 0.516 | 0.003 |
| RF | 0.546 | 0.003 |
| GBR | 0.542 | 0.003 |
| XGB | 0.544 | 0.003 |
All the models have a very low mean squared error of 0.003. We can take the square root of this (root mean squared error) to interpret the result. This differs from mean absolute error, which is the absolute value of the differences. RMSE is better here because it penalizes large errors more, so it’s more valuable for this problem.
Because the mean squared error for each model is about 0.003, the RMSE is about 0.055. This means that, on average, the models are about 5.5% off in predicted percent of cap.
In our classification problems, we create dummy classifiers to represent improvement over random. It’s harder to create a random model here. However, we can still compare our models to simple regressions. We saw before that the correlation coefficient (r) for a points and salary regression is 0.6. So, the r-squared is 0.36. Our models all have r-squared above 0.5, so they outperform simple methods to predict salary. So, the models predict salary well.
Cross-validation
In machine learning, we want to avoid overfitting. This occurs when the models learn the given data too well. So, they’re accurate on the given data but aren’t predictive on new data. To check for overfitting, we’ll perform cross-validation.
First, as in previous posts, we performed grid search on our hyperparameters. This means we tested lots of possible combinations for factors that determine how our models fit the data. Then, we selected the combination that resulted in the lowest MSE on different splits.
Additionally, we performed k-fold cross-validation. In k-fold cross-validation, we randomly split the data into k bins. The models receive k – 1 bins as training data, and then predict the one excluded bin. We repeat this process for every combination of bins. Then, we average the performance across the bins. This gives us an estimate of how our models perform on different splits of the data. A cross-validated score close to our initial score indicates the model performs almost the same on the different splits. So, if the two scores are close, it’s unlikely the models are overfitting.
The table below shows the cross-validation scores for r-squared and MSE, along with their 95% confidence intervals (2 standard deviations away from the mean).
| Model | r-squared | 95% CI | MSE | 95% CI |
|---|---|---|---|---|
| KNN | 0.507 | +/- 0.071 | 0.004 | +/- 0.001 |
| RF | 0.469 | +/- 0.150 | 0.004 | +/- 0.001 |
| GBR | 0.421 | +/- 0.281 | 0.004 | +/- 0.002 |
| XGB | 0.444 | +/- 0.199 | 0.004 | +/- 0.001 |
Though the CV r-squared scores are lower, the actual r-squared scores are within the 95% confidence interval. Furthermore, the CV MSE is very close to the initial MSE. So, it’s unlikely the models are overfitting.
Standardized residuals
A big part of regression analysis depends on analyzing the residuals. A residual is the difference between the predicted and observed value at a point.
Residuals in strong models have two important characteristics. First, they follow the normal distribution. Second, they have no autocorrelation or trend. Both these characteristics show that the model isn’t repeating the same mistake.
First, we’ll look at the standardized residuals test. Ideally, 95% of a model’s standardized residuals fall within 2 standard deviations of the mean. Furthermore, the standardized residuals should have no noticeable trend.
The graph below shows the standardized residuals of the four models.
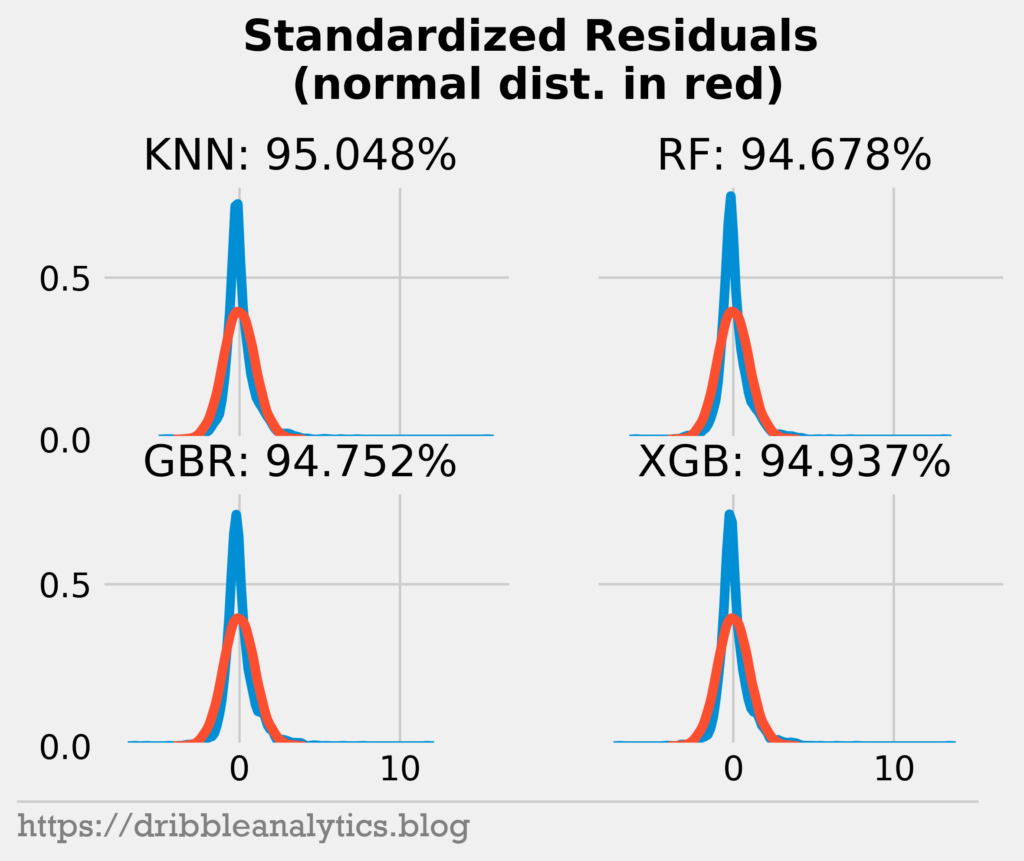
We see that only the KNN has 95% of its residuals within 2 standard deviations of the mean. The others are close to 95% (they’re all over 94.6%). This 95% is not a hard boundary; it exists because, in a normal distribution, 95% of data is within 2 standard deviations of the mean. So, the fact that close to 95% of the data is within 2 standard deviations is good.
The distributions of the standard residuals differ from a normal distribution. We see that the residuals peak close to 0 far above the expected density for a normal distribution. Furthermore, there are some residuals far away from most of the data. So, our residuals are probably heavy-tailed and not normal.
To analyze this assumption, we’ll perform a Shapiro-Wilk test for normality. The test returns a p-value and a w-value (not important here). If the p-value is less than 0.05, we can reject the null hypothesis, which is that the data is normally distributed. So, if p < 0.05, the data is not normal. The table below shows the p-values of the Shapiro-Wilk test.
| Model | p-value |
|---|---|
| KNN | < 0.001 |
| RF | < 0.001 |
| GBR | < 0.001 |
| XGB | < 0.001 |
The p-value is small for all four models, so we can reject the null hypothesis. So, our standardized residuals are not normally distributed. This low p-value may be a result of a large sample size. To confirm this isn’t due to sample size, we’ll also look at a quantile-quantile (QQ) plot.
The QQ plot shows the theoretical quantiles and the order values of two distributions. If the two distributions are the same, their QQ plot will be a straight line. So, we will plot the residuals against a normal distribution (shown in red). The closer our points are to the red line, the better. The graph below shows each model’s QQ plot.
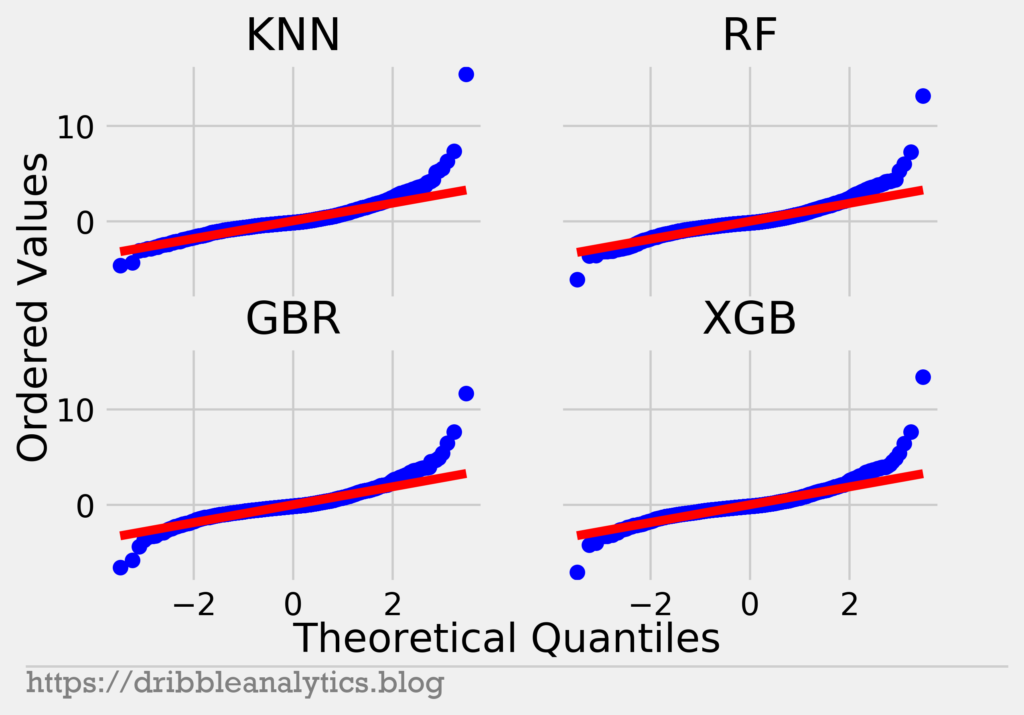
We see that the residuals stay close to the line for most of the middle values. At the upper and lower ends, the residuals differ a lot. This indicates the residuals have heavy tails like we thought before. So, we can confidently say the model’s residuals are not normal.
Now, we will test for autocorrelation. To do this, we’ll perform a Durbin-Watson test. The test returns a Durbin-Watson statistic between 0 and 4. Values close to 2 indicate no autocorrelation. Values close to 0 indicate positive autocorrelation. Values close to 4 indicate negative autocorrelation. The table below shows the results of the DW test.
| Model | DW statistic |
|---|---|
| KNN | 1.97 |
| RF | 1.99 |
| GBR | 1.99 |
| XGB | 1.99 |
The DW statistic for each model is close to 2. So, there’s no autocorrelation in the residuals, which is promising.
Though our residuals are not normal, which is a problem, the models are still useful. The residuals have no autocorrelation – meaning the model is not repeating the same mistake – and the models have no error. Now that we’ve evaluated the models, we can see what they predict.
Results
As mentioned earlier, rookie contracts are bargains. This is because their contracts depend on their draft position. Furthermore, they’re non-negotiable, as the rookie scale continues for 4 years.
Before diving into results, we’ll look at an example of how our models treat rookies. Last year, Luka Doncic put up 21.2 PPG, 7.8 RPG, and 6 APG on good efficiency at 19 years old. So, even though he’s a great player, his expected salary is low because he’s on a rookie contract.
Our models predicted Luka Doncic to earn 12% of the cap. This is higher than his actual percent of cap of about 6.5%. So, he’s still a bargain given his expected salary. However, a player putting up Doncic’s stats would earn far more than 12% of the cap on the open market. This shows that our models identify the effect of age.
Now, we’ll let the models predict what Luka Doncic would earn at 27 years old if he put up the same stats. Given Doncic was 19 his rookie year, he will start his rookie maximum contract when he’s 23. That contract will take up 25% of the cap with 8% annual raises.
The models predict Doncic will be worth 23% of the cap if he put up his rookie stats (which he’s already improved on this year) at 27 years old. This is close to what he’ll make depending on how fast the cap rises. Because of the large difference in salary depending on age, we know the models capture the effect of age. So, they won’t identify all rookie contracts as bargains, as they know the expectation for rookies.
Now that we understand this, we can examine the results.
We’ll look at both player-by-player and team-by-team differences between expected and actual percent of cap. Higher values mean the player is great value, as he’s earning below his expected salary. We can sum these across teams to see which teams overpay players and which teams get good value.
The graph below shows the top 10 best value contracts as decided by the average of our four models.
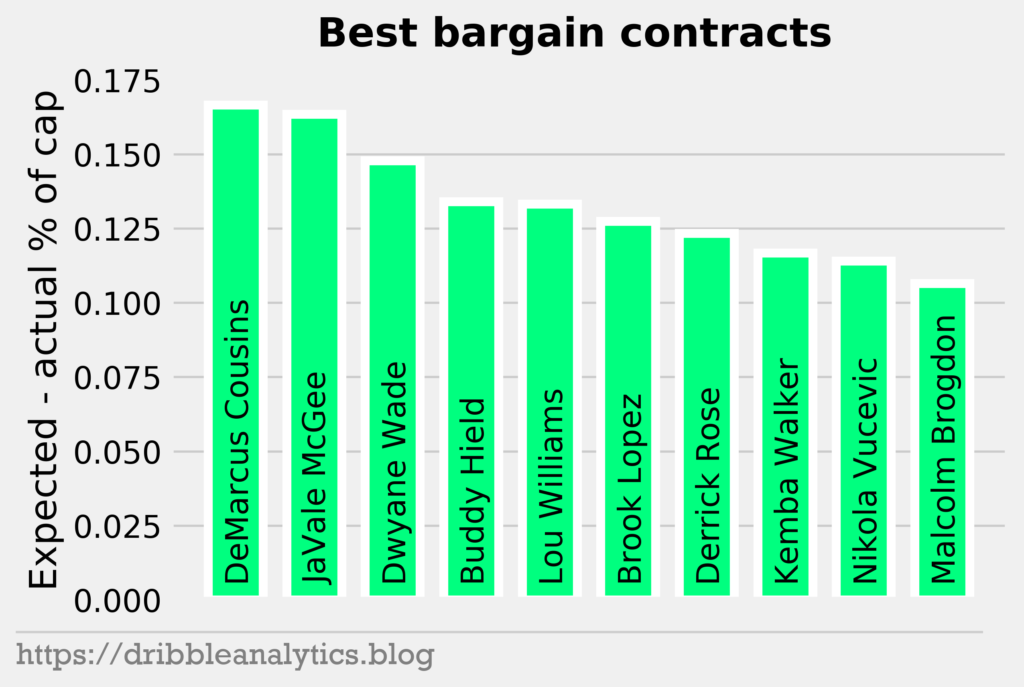
This list has some players we’d expect. Last season, Kemba earned only $12 million, a great value. Several of the players here signed a minimum contract or an exception like DeMarcus Cousins and Brook Lopez. Despite our earlier example of how the models filter out rookie contracts, there are still two rookie contract players here. But, they’re both older than typical rookie contract players. Last season, both Buddy Hield and Malcolm Brogdon were 26 years old. This is about as old as a player can get on their rookie contract unless they’re an international player. So, their age prevents their expected value from regressing to that of a rookie contract.
Now, let’s look at the worst value contracts.
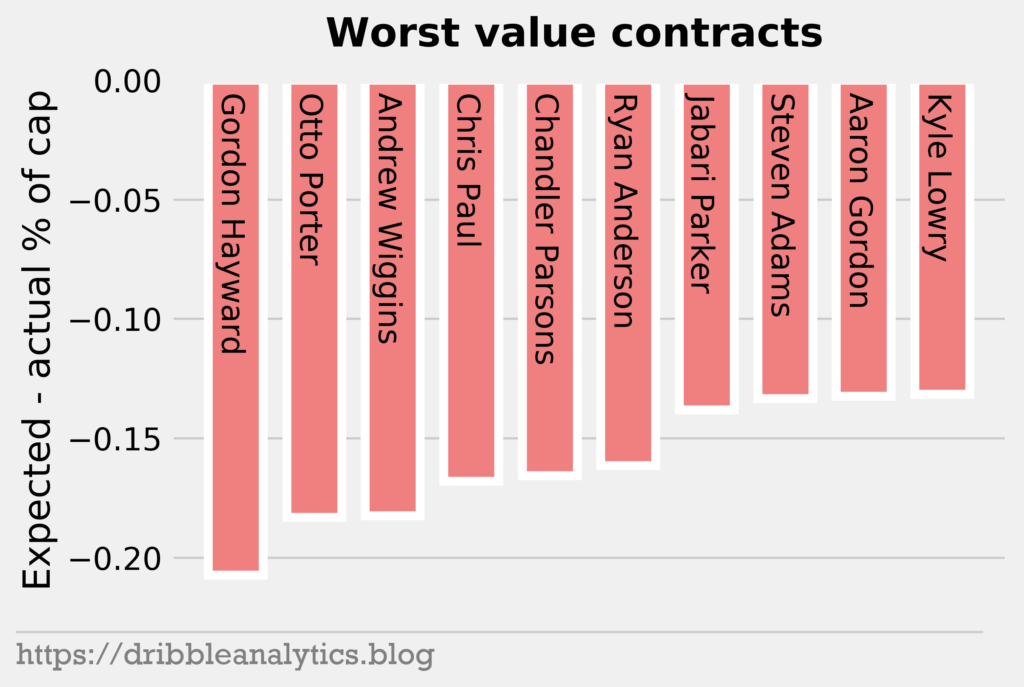
This contains the usual suspects for the worst contracts. Before his improvement this year, Andrew Wiggins had one of the worst contracts in the league. Furthermore, Hayward’s injury recovery made him perform far below what you’d expect for a max player. We also have some less recent poison contracts, like Otto Porter, Chandler Parsons, and Ryan Anderson.
Let’s look at which teams handed out the best contracts last year. We do this by summing the difference in expected and actual salary for every player on the roster.
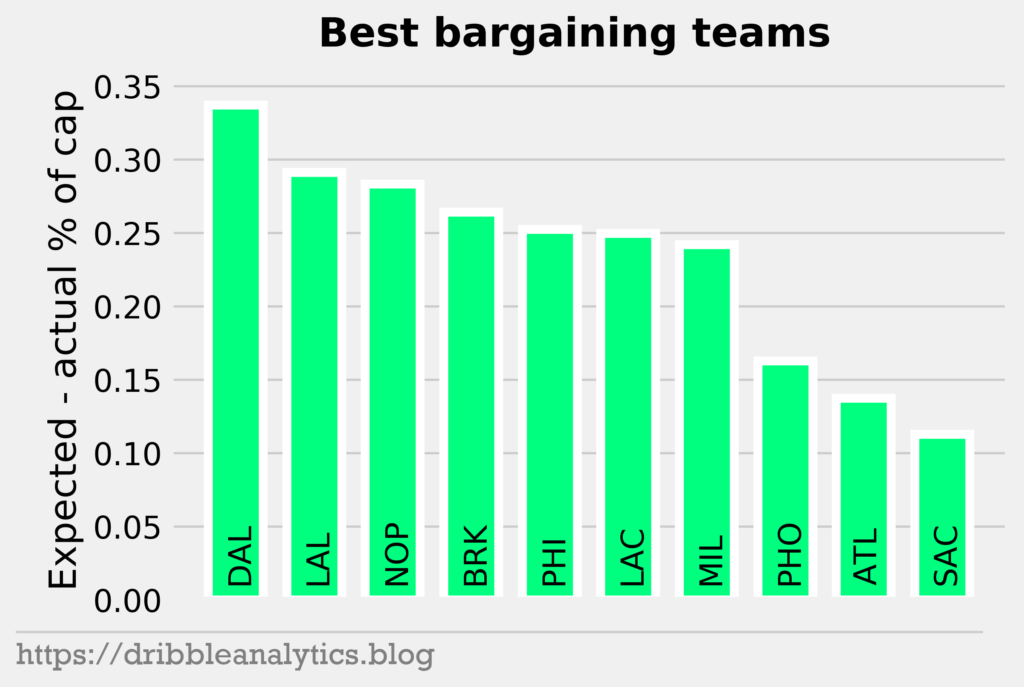
All the teams on this list have lots of good role players or young talent. Though the Lakers, Pelicans, and Bucks all had a max player (LeBron, Davis, Giannis), a max is great value for those players. Furthermore, the rest of the team had great value contracts. We see that the teams here made big moves over the summer, often resulting in improvement. The Lakers added Davis. The Pelicans added young talent. The Nets signed Kyrie and KD. The 76ers signed Horford. The Clippers signed Kawhi and traded for Paul George.
Now, let’s look at the teams with the worst value contracts.
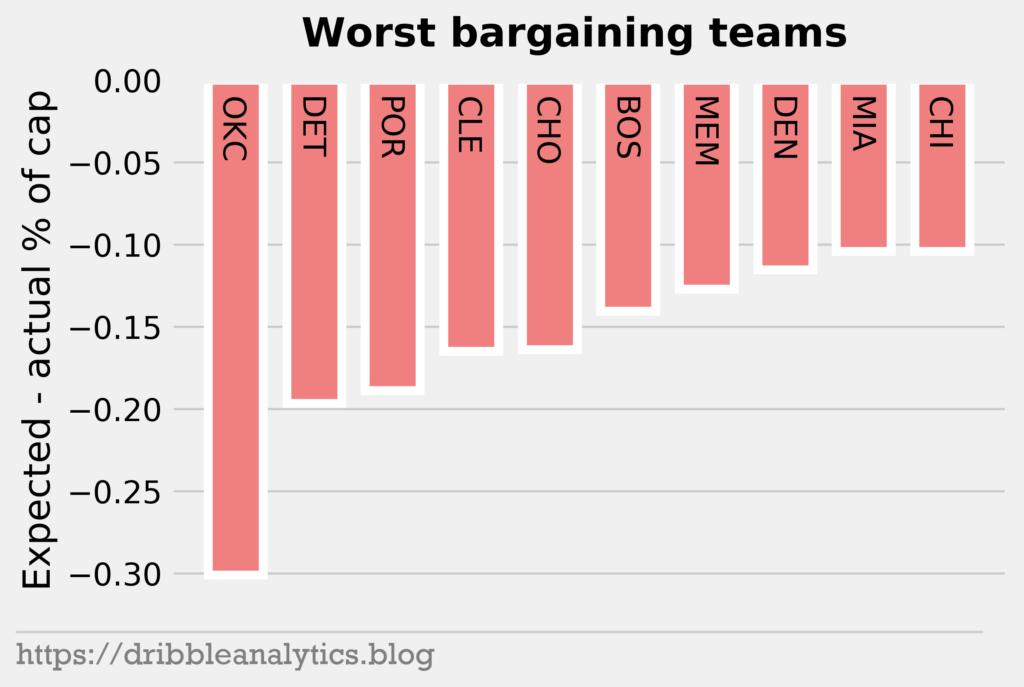
OKC had the worst cumulative value difference by a large value. Westbrook’s max and Steven Adams’ large contract contribute to this. We see that a lot of the teams here ended up tanking or in limbo. For example, the Thunder traded Westbrook and George. The struggling Pistons held onto Griffin and Drummond and now look even worse.
Though it’s bad to be a team in the above graph, for tanking teams, it can be good. Tanking teams often receive salary dumps, where they take on a bad contract in exchange for picks. So, they’ll have a negative difference, but it’s worth it because of the attached assets.
Let’s look at the distribution of our predicted salary relative to the actual salary distribution.
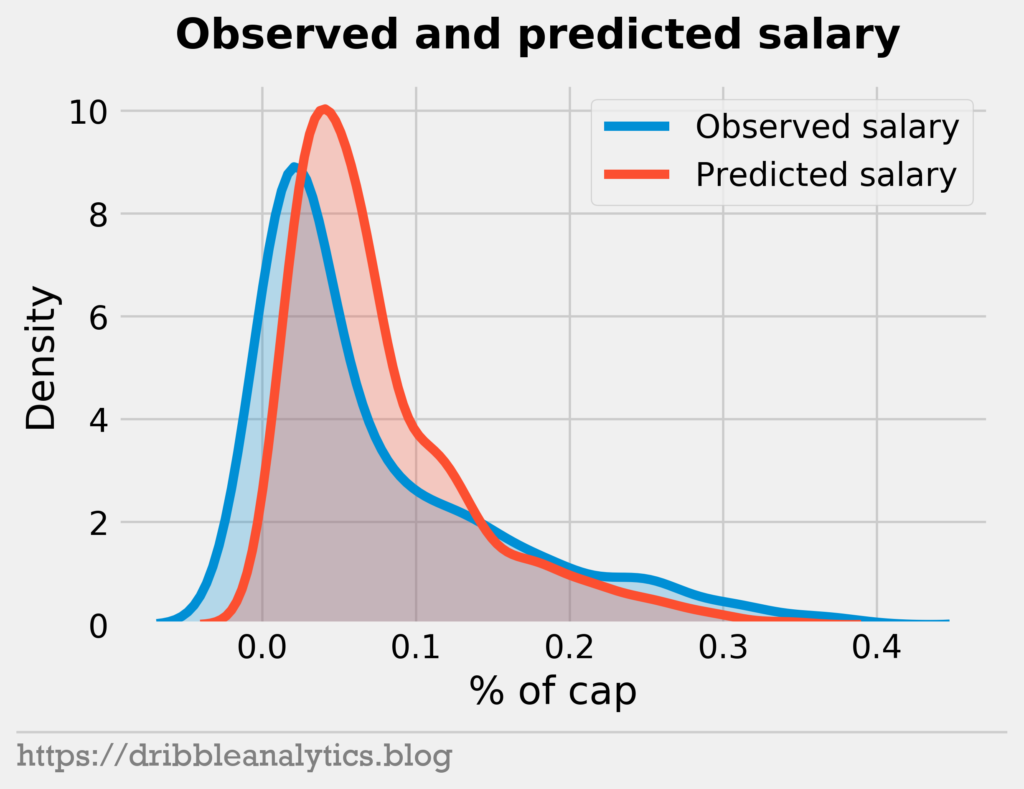
We see that the predicted distribution is a right-shift of the observed distribution. Minimum contracts and exceptions contribute to this, as good players often take discounts to play for contenders.
Full individual results
The table below shows the predicted salary for each player and the difference between expected and actual salary.
| player | salary | percent_of_cap | knn | rf | gbr | xgb | avg | diff |
|---|---|---|---|---|---|---|---|---|
| Stephen Curry | $37,457,154 | 0.38 | 0.32 | 0.28 | 0.23 | 0.25 | 0.27 | -0.11 |
| Chris Paul | $35,654,150 | 0.36 | 0.19 | 0.21 | 0.18 | 0.19 | 0.19 | -0.17 |
| Russell Westbrook | $35,654,150 | 0.36 | 0.25 | 0.26 | 0.29 | 0.30 | 0.27 | -0.09 |
| LeBron James | $35,654,150 | 0.36 | 0.32 | 0.34 | 0.33 | 0.37 | 0.34 | -0.02 |
| Blake Griffin | $32,088,932 | 0.32 | 0.27 | 0.25 | 0.24 | 0.25 | 0.25 | -0.07 |
| Gordon Hayward | $31,214,295 | 0.32 | 0.10 | 0.11 | 0.11 | 0.11 | 0.11 | -0.21 |
| Kyle Lowry | $31,200,000 | 0.31 | 0.19 | 0.17 | 0.18 | 0.19 | 0.18 | -0.13 |
| Paul George | $30,560,700 | 0.31 | 0.27 | 0.26 | 0.25 | 0.25 | 0.26 | -0.05 |
| Mike Conley | $30,521,116 | 0.31 | 0.19 | 0.20 | 0.21 | 0.21 | 0.20 | -0.10 |
| James Harden | $30,431,854 | 0.31 | 0.31 | 0.27 | 0.30 | 0.28 | 0.29 | -0.02 |
| Kevin Durant | $30,000,000 | 0.30 | 0.29 | 0.28 | 0.26 | 0.26 | 0.27 | -0.03 |
| Paul Millsap | $29,730,769 | 0.30 | 0.20 | 0.17 | 0.17 | 0.15 | 0.17 | -0.13 |
| Al Horford | $28,928,710 | 0.29 | 0.23 | 0.22 | 0.21 | 0.22 | 0.22 | -0.07 |
| Damian Lillard | $27,977,689 | 0.28 | 0.26 | 0.27 | 0.23 | 0.23 | 0.25 | -0.04 |
| DeMar DeRozan | $27,739,975 | 0.28 | 0.21 | 0.22 | 0.23 | 0.24 | 0.22 | -0.06 |
| Otto Porter | $26,011,913 | 0.26 | 0.08 | 0.08 | 0.08 | 0.08 | 0.08 | -0.18 |
| Jrue Holiday | $25,976,111 | 0.26 | 0.21 | 0.23 | 0.22 | 0.21 | 0.22 | -0.05 |
| CJ McCollum | $25,759,766 | 0.26 | 0.18 | 0.19 | 0.18 | 0.18 | 0.18 | -0.08 |
| Carmelo Anthony | $25,534,253 | 0.26 | 0.15 | 0.17 | 0.14 | 0.15 | 0.15 | -0.11 |
| Andrew Wiggins | $25,467,250 | 0.26 | 0.08 | 0.08 | 0.07 | 0.08 | 0.07 | -0.18 |
| Joel Embiid | $25,467,250 | 0.26 | 0.21 | 0.28 | 0.25 | 0.28 | 0.25 | 0.00 |
| Bradley Beal | $25,434,263 | 0.26 | 0.21 | 0.22 | 0.19 | 0.19 | 0.20 | -0.06 |
| Anthony Davis | $25,434,263 | 0.26 | 0.23 | 0.27 | 0.24 | 0.25 | 0.25 | -0.01 |
| Andre Drummond | $25,434,263 | 0.26 | 0.17 | 0.17 | 0.14 | 0.17 | 0.16 | -0.10 |
| Hassan Whiteside | $25,434,263 | 0.26 | 0.16 | 0.19 | 0.18 | 0.17 | 0.18 | -0.08 |
| Nikola Jokic | $24,605,181 | 0.25 | 0.19 | 0.20 | 0.16 | 0.16 | 0.18 | -0.07 |
| Steven Adams | $24,157,304 | 0.24 | 0.13 | 0.12 | 0.10 | 0.10 | 0.11 | -0.13 |
| Giannis Antetokounmpo | $24,157,304 | 0.24 | 0.27 | 0.33 | 0.28 | 0.30 | 0.30 | 0.05 |
| Kevin Love | $24,119,025 | 0.24 | 0.23 | 0.19 | 0.17 | 0.18 | 0.19 | -0.05 |
| Marc Gasol | $24,119,025 | 0.24 | 0.25 | 0.24 | 0.21 | 0.21 | 0.23 | -0.02 |
| Chandler Parsons | $24,107,258 | 0.24 | 0.07 | 0.08 | 0.08 | 0.08 | 0.08 | -0.17 |
| Harrison Barnes | $24,107,258 | 0.24 | 0.14 | 0.14 | 0.12 | 0.12 | 0.13 | -0.11 |
| Nicolas Batum | $24,000,000 | 0.24 | 0.12 | 0.12 | 0.11 | 0.10 | 0.11 | -0.13 |
| Rudy Gobert | $23,241,573 | 0.23 | 0.17 | 0.21 | 0.22 | 0.23 | 0.21 | -0.03 |
| Kawhi Leonard | $23,114,067 | 0.23 | 0.27 | 0.24 | 0.21 | 0.20 | 0.23 | 0.00 |
| DeAndre Jordan | $22,900,000 | 0.23 | 0.17 | 0.19 | 0.17 | 0.17 | 0.17 | -0.06 |
| LaMarcus Aldridge | $22,347,015 | 0.23 | 0.30 | 0.28 | 0.33 | 0.31 | 0.30 | 0.08 |
| Serge Ibaka | $21,666,667 | 0.22 | 0.19 | 0.21 | 0.21 | 0.21 | 0.20 | -0.01 |
| Aaron Gordon | $21,590,909 | 0.22 | 0.10 | 0.08 | 0.09 | 0.08 | 0.09 | -0.13 |
| Danilo Gallinari | $21,587,579 | 0.22 | 0.22 | 0.19 | 0.17 | 0.17 | 0.19 | -0.03 |
| Victor Oladipo | $21,000,000 | 0.21 | 0.15 | 0.16 | 0.18 | 0.18 | 0.17 | -0.04 |
| Jimmy Butler | $20,445,779 | 0.21 | 0.16 | 0.16 | 0.17 | 0.17 | 0.16 | -0.04 |
| Ryan Anderson | $20,421,546 | 0.21 | 0.04 | 0.05 | 0.04 | 0.04 | 0.04 | -0.16 |
| Kyrie Irving | $20,099,189 | 0.20 | 0.23 | 0.23 | 0.21 | 0.20 | 0.22 | 0.01 |
| Jabari Parker | $20,000,000 | 0.20 | 0.06 | 0.06 | 0.07 | 0.07 | 0.06 | -0.14 |
| Zach LaVine | $19,500,000 | 0.20 | 0.15 | 0.09 | 0.11 | 0.10 | 0.11 | -0.08 |
| Tyler Johnson | $19,245,370 | 0.19 | 0.09 | 0.06 | 0.06 | 0.06 | 0.07 | -0.12 |
| John Wall | $19,169,800 | 0.19 | 0.17 | 0.23 | 0.21 | 0.22 | 0.21 | 0.02 |
| George Hill | $19,000,000 | 0.19 | 0.07 | 0.07 | 0.08 | 0.08 | 0.07 | -0.12 |
| Jeff Teague | $19,000,000 | 0.19 | 0.14 | 0.13 | 0.13 | 0.13 | 0.13 | -0.06 |
| Klay Thompson | $18,988,725 | 0.19 | 0.18 | 0.18 | 0.18 | 0.18 | 0.18 | -0.01 |
| Dwight Howard | $18,919,725 | 0.19 | 0.16 | 0.17 | 0.16 | 0.15 | 0.16 | -0.03 |
| Enes Kanter | $18,622,514 | 0.19 | 0.12 | 0.13 | 0.12 | 0.12 | 0.12 | -0.07 |
| Wesley Matthews | $18,622,514 | 0.19 | 0.11 | 0.11 | 0.12 | 0.12 | 0.12 | -0.07 |
| Joakim Noah | $18,530,000 | 0.19 | 0.14 | 0.12 | 0.10 | 0.10 | 0.12 | -0.07 |
| Allen Crabbe | $18,500,000 | 0.19 | 0.05 | 0.06 | 0.06 | 0.06 | 0.06 | -0.13 |
| Goran Dragic | $18,109,175 | 0.18 | 0.14 | 0.13 | 0.14 | 0.15 | 0.14 | -0.04 |
| Kent Bazemore | $18,089,887 | 0.18 | 0.14 | 0.13 | 0.11 | 0.11 | 0.12 | -0.06 |
| Evan Turner | $17,868,852 | 0.18 | 0.11 | 0.10 | 0.10 | 0.10 | 0.10 | -0.08 |
| Draymond Green | $17,469,565 | 0.18 | 0.10 | 0.14 | 0.15 | 0.15 | 0.13 | -0.04 |
| Tristan Thompson | $17,469,565 | 0.18 | 0.12 | 0.11 | 0.12 | 0.12 | 0.12 | -0.06 |
| Tim Hardaway | $17,325,000 | 0.17 | 0.14 | 0.14 | 0.13 | 0.13 | 0.13 | -0.04 |
| Reggie Jackson | $17,043,478 | 0.17 | 0.12 | 0.12 | 0.12 | 0.12 | 0.12 | -0.05 |
| Evan Fournier | $17,000,000 | 0.17 | 0.12 | 0.11 | 0.11 | 0.11 | 0.11 | -0.06 |
| Bismack Biyombo | $17,000,000 | 0.17 | 0.06 | 0.05 | 0.05 | 0.05 | 0.05 | -0.12 |
| Derrick Favors | $16,900,000 | 0.17 | 0.12 | 0.17 | 0.14 | 0.14 | 0.14 | -0.03 |
| Jonas Valanciunas | $16,539,326 | 0.17 | 0.13 | 0.15 | 0.14 | 0.14 | 0.14 | -0.03 |
| Gary Harris | $16,517,857 | 0.17 | 0.06 | 0.07 | 0.06 | 0.06 | 0.06 | -0.10 |
| Andre Iguodala | $16,000,000 | 0.16 | 0.07 | 0.08 | 0.08 | 0.08 | 0.08 | -0.08 |
| Ian Mahinmi | $15,944,154 | 0.16 | 0.07 | 0.07 | 0.08 | 0.08 | 0.07 | -0.09 |
| Dennis Schroder | $15,500,000 | 0.16 | 0.10 | 0.09 | 0.10 | 0.10 | 0.10 | -0.06 |
| DeMarre Carroll | $15,400,000 | 0.16 | 0.11 | 0.10 | 0.12 | 0.12 | 0.11 | -0.04 |
| Clint Capela | $15,293,104 | 0.15 | 0.13 | 0.13 | 0.15 | 0.14 | 0.14 | -0.02 |
| Gorgui Dieng | $15,170,787 | 0.15 | 0.05 | 0.06 | 0.08 | 0.07 | 0.07 | -0.09 |
| Pau Gasol | $15,100,000 | 0.15 | 0.04 | 0.08 | 0.08 | 0.08 | 0.07 | -0.08 |
| Eric Bledsoe | $15,000,000 | 0.15 | 0.14 | 0.15 | 0.16 | 0.17 | 0.16 | 0.01 |
| Trevor Ariza | $15,000,000 | 0.15 | 0.15 | 0.14 | 0.14 | 0.14 | 0.14 | -0.01 |
| Ricky Rubio | $14,975,000 | 0.15 | 0.13 | 0.12 | 0.12 | 0.12 | 0.12 | -0.03 |
| Tobias Harris | $14,800,000 | 0.15 | 0.19 | 0.20 | 0.20 | 0.20 | 0.20 | 0.05 |
| J.R. Smith | $14,720,000 | 0.15 | 0.06 | 0.06 | 0.07 | 0.07 | 0.07 | -0.08 |
| James Johnson | $14,651,700 | 0.15 | 0.08 | 0.08 | 0.09 | 0.09 | 0.08 | -0.06 |
| Brandon Knight | $14,631,250 | 0.15 | 0.05 | 0.06 | 0.05 | 0.05 | 0.05 | -0.10 |
| Robin Lopez | $14,357,750 | 0.14 | 0.10 | 0.10 | 0.10 | 0.10 | 0.10 | -0.05 |
| Luol Deng | $14,354,067 | 0.14 | 0.11 | 0.07 | 0.07 | 0.07 | 0.08 | -0.07 |
| Marvin Williams | $14,087,500 | 0.14 | 0.11 | 0.11 | 0.12 | 0.12 | 0.12 | -0.03 |
| Taj Gibson | $14,000,000 | 0.14 | 0.13 | 0.13 | 0.14 | 0.13 | 0.13 | -0.01 |
| Jeremy Lin | $13,768,421 | 0.14 | 0.08 | 0.07 | 0.07 | 0.07 | 0.07 | -0.07 |
| Thaddeus Young | $13,764,045 | 0.14 | 0.14 | 0.14 | 0.15 | 0.14 | 0.14 | 0.00 |
| Kenneth Faried | $13,764,045 | 0.14 | 0.12 | 0.11 | 0.11 | 0.12 | 0.11 | -0.02 |
| Tyson Chandler | $13,585,000 | 0.14 | 0.08 | 0.07 | 0.07 | 0.07 | 0.07 | -0.07 |
| Marcin Gortat | $13,565,218 | 0.14 | 0.08 | 0.10 | 0.10 | 0.09 | 0.09 | -0.04 |
| Cody Zeller | $13,528,090 | 0.14 | 0.08 | 0.06 | 0.08 | 0.08 | 0.07 | -0.06 |
| Eric Gordon | $13,500,375 | 0.14 | 0.10 | 0.13 | 0.14 | 0.14 | 0.13 | -0.01 |
| Joe Ingles | $13,045,455 | 0.13 | 0.12 | 0.12 | 0.13 | 0.12 | 0.12 | -0.01 |
| Khris Middleton | $13,000,000 | 0.13 | 0.14 | 0.16 | 0.16 | 0.15 | 0.15 | 0.02 |
| Michael Kidd-Gilchrist | $13,000,000 | 0.13 | 0.05 | 0.05 | 0.05 | 0.05 | 0.05 | -0.08 |
| Mason Plumlee | $12,917,808 | 0.13 | 0.11 | 0.11 | 0.11 | 0.10 | 0.11 | -0.02 |
| Wilson Chandler | $12,800,562 | 0.13 | 0.13 | 0.08 | 0.09 | 0.08 | 0.09 | -0.03 |
| Nikola Vucevic | $12,750,000 | 0.13 | 0.25 | 0.23 | 0.25 | 0.25 | 0.24 | 0.11 |
| Jordan Clarkson | $12,500,000 | 0.13 | 0.15 | 0.14 | 0.12 | 0.12 | 0.13 | 0.01 |
| Miles Plumlee | $12,500,000 | 0.13 | 0.07 | 0.05 | 0.04 | 0.04 | 0.05 | -0.08 |
| Nikola Mirotic | $12,500,000 | 0.13 | 0.13 | 0.14 | 0.14 | 0.15 | 0.14 | 0.01 |
| Tyreke Evans | $12,400,000 | 0.13 | 0.09 | 0.10 | 0.10 | 0.10 | 0.10 | -0.03 |
| Courtney Lee | $12,253,780 | 0.12 | 0.05 | 0.05 | 0.05 | 0.05 | 0.05 | -0.07 |
| Solomon Hill | $12,252,928 | 0.12 | 0.05 | 0.06 | 0.05 | 0.05 | 0.05 | -0.07 |
| J.J. Redick | $12,250,000 | 0.12 | 0.22 | 0.18 | 0.18 | 0.17 | 0.19 | 0.06 |
| Kelly Olynyk | $12,137,527 | 0.12 | 0.07 | 0.09 | 0.08 | 0.08 | 0.08 | -0.04 |
| Austin Rivers | $12,000,000 | 0.12 | 0.05 | 0.04 | 0.04 | 0.05 | 0.05 | -0.08 |
| Avery Bradley | $12,000,000 | 0.12 | 0.06 | 0.09 | 0.08 | 0.08 | 0.08 | -0.04 |
| Kentavious Caldwell-Pope | $12,000,000 | 0.12 | 0.06 | 0.05 | 0.05 | 0.05 | 0.05 | -0.07 |
| Kemba Walker | $12,000,000 | 0.12 | 0.24 | 0.25 | 0.23 | 0.23 | 0.24 | 0.12 |
| Will Barton | $11,830,358 | 0.12 | 0.13 | 0.13 | 0.12 | 0.12 | 0.12 | 0.01 |
| T.J. Warren | $11,750,000 | 0.12 | 0.13 | 0.12 | 0.10 | 0.11 | 0.12 | 0.00 |
| Marcus Smart | $11,660,716 | 0.12 | 0.04 | 0.05 | 0.03 | 0.03 | 0.04 | -0.08 |
| Patty Mills | $11,571,429 | 0.12 | 0.08 | 0.07 | 0.07 | 0.07 | 0.07 | -0.05 |
| Dion Waiters | $11,550,000 | 0.12 | 0.10 | 0.10 | 0.09 | 0.09 | 0.10 | -0.02 |
| Alec Burks | $11,536,515 | 0.12 | 0.05 | 0.07 | 0.08 | 0.07 | 0.07 | -0.05 |
| John Henson | $11,327,466 | 0.11 | 0.09 | 0.09 | 0.08 | 0.08 | 0.09 | -0.03 |
| Jusuf Nurkic | $11,111,111 | 0.11 | 0.14 | 0.16 | 0.13 | 0.13 | 0.14 | 0.03 |
| Iman Shumpert | $11,011,234 | 0.11 | 0.07 | 0.07 | 0.07 | 0.07 | 0.07 | -0.04 |
| Maurice Harkless | $10,837,079 | 0.11 | 0.05 | 0.05 | 0.06 | 0.05 | 0.05 | -0.06 |
| Tony Snell | $10,607,143 | 0.11 | 0.05 | 0.04 | 0.03 | 0.03 | 0.04 | -0.07 |
| Meyers Leonard | $10,595,506 | 0.11 | 0.04 | 0.05 | 0.04 | 0.04 | 0.04 | -0.06 |
| Terrence Ross | $10,500,000 | 0.11 | 0.09 | 0.11 | 0.12 | 0.12 | 0.11 | 0.00 |
| Bojan Bogdanovic | $10,500,000 | 0.11 | 0.16 | 0.16 | 0.14 | 0.14 | 0.15 | 0.05 |
| Robert Covington | $10,464,092 | 0.11 | 0.12 | 0.17 | 0.13 | 0.13 | 0.14 | 0.03 |
| Rudy Gay | $10,087,200 | 0.10 | 0.18 | 0.15 | 0.17 | 0.17 | 0.17 | 0.07 |
| Jon Leuer | $10,002,681 | 0.10 | 0.05 | 0.04 | 0.03 | 0.03 | 0.04 | -0.06 |
| Danny Green | $10,000,000 | 0.10 | 0.10 | 0.09 | 0.10 | 0.10 | 0.10 | 0.00 |
| Darren Collison | $10,000,000 | 0.10 | 0.12 | 0.12 | 0.10 | 0.11 | 0.11 | 0.01 |
| Dwight Powell | $9,631,250 | 0.10 | 0.07 | 0.11 | 0.09 | 0.09 | 0.09 | -0.01 |
| Matthew Dellavedova | $9,607,500 | 0.10 | 0.05 | 0.04 | 0.04 | 0.04 | 0.05 | -0.05 |
| Dante Exum | $9,600,000 | 0.10 | 0.03 | 0.03 | 0.03 | 0.03 | 0.03 | -0.07 |
| Jared Dudley | $9,530,000 | 0.10 | 0.06 | 0.06 | 0.07 | 0.07 | 0.06 | -0.03 |
| Norman Powell | $9,367,200 | 0.09 | 0.05 | 0.04 | 0.03 | 0.03 | 0.04 | -0.06 |
| Josh Richardson | $9,367,200 | 0.09 | 0.10 | 0.10 | 0.11 | 0.11 | 0.11 | 0.01 |
| Bogdan Bogdanovic | $9,000,000 | 0.09 | 0.08 | 0.10 | 0.10 | 0.10 | 0.09 | 0.00 |
| Rajon Rondo | $9,000,000 | 0.09 | 0.09 | 0.17 | 0.15 | 0.15 | 0.14 | 0.05 |
| E'Twaun Moore | $8,808,685 | 0.09 | 0.12 | 0.09 | 0.10 | 0.10 | 0.10 | 0.01 |
| Kosta Koufos | $8,739,500 | 0.09 | 0.07 | 0.07 | 0.08 | 0.08 | 0.07 | -0.01 |
| Jerami Grant | $8,653,847 | 0.09 | 0.07 | 0.07 | 0.07 | 0.07 | 0.07 | -0.02 |
| Fred VanVleet | $8,653,847 | 0.09 | 0.05 | 0.04 | 0.05 | 0.05 | 0.05 | -0.04 |
| Kyle Anderson | $8,641,000 | 0.09 | 0.06 | 0.07 | 0.07 | 0.07 | 0.07 | -0.02 |
| Julius Randle | $8,641,000 | 0.09 | 0.19 | 0.18 | 0.19 | 0.18 | 0.18 | 0.09 |
| Markieff Morris | $8,600,000 | 0.09 | 0.10 | 0.10 | 0.10 | 0.10 | 0.10 | 0.01 |
| Jerryd Bayless | $8,575,916 | 0.09 | 0.06 | 0.08 | 0.07 | 0.07 | 0.07 | -0.02 |
| Cristiano Felicio | $8,470,980 | 0.09 | 0.05 | 0.04 | 0.04 | 0.04 | 0.04 | -0.04 |
| Markelle Fultz | $8,339,880 | 0.08 | 0.04 | 0.04 | 0.05 | 0.05 | 0.05 | -0.04 |
| Joe Harris | $8,333,333 | 0.08 | 0.09 | 0.11 | 0.10 | 0.10 | 0.10 | 0.01 |
| C.J. Miles | $8,333,333 | 0.08 | 0.06 | 0.06 | 0.06 | 0.06 | 0.06 | -0.02 |
| Shaun Livingston | $8,307,692 | 0.08 | 0.04 | 0.05 | 0.06 | 0.05 | 0.05 | -0.03 |
| Deandre Ayton | $8,165,160 | 0.08 | 0.08 | 0.06 | 0.05 | 0.05 | 0.06 | -0.02 |
| Lou Williams | $8,000,000 | 0.08 | 0.22 | 0.20 | 0.22 | 0.22 | 0.21 | 0.13 |
| Garrett Temple | $8,000,000 | 0.08 | 0.08 | 0.08 | 0.08 | 0.08 | 0.08 | 0.00 |
| P.J. Tucker | $7,969,537 | 0.08 | 0.12 | 0.10 | 0.11 | 0.11 | 0.11 | 0.03 |
| Cory Joseph | $7,945,000 | 0.08 | 0.04 | 0.09 | 0.07 | 0.07 | 0.07 | -0.01 |
| JaMychal Green | $7,866,667 | 0.08 | 0.12 | 0.10 | 0.10 | 0.10 | 0.10 | 0.02 |
| Karl-Anthony Towns | $7,839,435 | 0.08 | 0.19 | 0.19 | 0.15 | 0.15 | 0.17 | 0.09 |
| Kyle Korver | $7,560,000 | 0.08 | 0.07 | 0.07 | 0.05 | 0.05 | 0.06 | -0.02 |
| Jeremy Lamb | $7,488,372 | 0.08 | 0.10 | 0.13 | 0.12 | 0.12 | 0.12 | 0.04 |
| Lonzo Ball | $7,461,960 | 0.08 | 0.05 | 0.05 | 0.07 | 0.07 | 0.06 | -0.01 |
| Doug McDermott | $7,333,334 | 0.07 | 0.06 | 0.04 | 0.04 | 0.04 | 0.05 | -0.03 |
| Jae Crowder | $7,305,825 | 0.07 | 0.11 | 0.11 | 0.12 | 0.11 | 0.11 | 0.04 |
| Marvin Bagley | $7,305,600 | 0.07 | 0.06 | 0.06 | 0.06 | 0.05 | 0.06 | -0.01 |
| D.J. Augustin | $7,250,000 | 0.07 | 0.11 | 0.11 | 0.11 | 0.11 | 0.11 | 0.04 |
| Dewayne Dedmon | $7,200,000 | 0.07 | 0.14 | 0.12 | 0.13 | 0.13 | 0.13 | 0.06 |
| Lance Thomas | $7,119,650 | 0.07 | 0.05 | 0.05 | 0.06 | 0.06 | 0.05 | -0.02 |
| D'Angelo Russell | $7,019,698 | 0.07 | 0.12 | 0.09 | 0.11 | 0.12 | 0.11 | 0.04 |
| Langston Galloway | $7,000,000 | 0.07 | 0.06 | 0.05 | 0.05 | 0.05 | 0.05 | -0.02 |
| Davis Bertans | $7,000,000 | 0.07 | 0.06 | 0.05 | 0.05 | 0.05 | 0.05 | -0.02 |
| Ersan Ilyasova | $7,000,000 | 0.07 | 0.09 | 0.08 | 0.09 | 0.09 | 0.09 | 0.02 |
| Boban Marjanovic | $7,000,000 | 0.07 | 0.09 | 0.09 | 0.09 | 0.09 | 0.09 | 0.02 |
| Al-Farouq Aminu | $6,957,105 | 0.07 | 0.11 | 0.10 | 0.11 | 0.11 | 0.11 | 0.04 |
| Jayson Tatum | $6,700,800 | 0.07 | 0.06 | 0.06 | 0.06 | 0.06 | 0.06 | -0.01 |
| Luka Doncic | $6,560,640 | 0.07 | 0.11 | 0.12 | 0.13 | 0.13 | 0.12 | 0.06 |
| Nemanja Bjelica | $6,500,000 | 0.07 | 0.15 | 0.11 | 0.10 | 0.11 | 0.12 | 0.05 |
| Mario Hezonja | $6,500,000 | 0.07 | 0.04 | 0.07 | 0.04 | 0.04 | 0.05 | -0.02 |
| Ben Simmons | $6,434,520 | 0.06 | 0.10 | 0.07 | 0.09 | 0.08 | 0.08 | 0.02 |
| Wayne Ellington | $6,270,000 | 0.06 | 0.08 | 0.08 | 0.09 | 0.08 | 0.08 | 0.02 |
| Marco Belinelli | $6,153,846 | 0.06 | 0.10 | 0.09 | 0.10 | 0.10 | 0.10 | 0.03 |
| Wesley Johnson | $6,134,520 | 0.06 | 0.05 | 0.05 | 0.06 | 0.06 | 0.05 | -0.01 |
| Josh Jackson | $6,041,520 | 0.06 | 0.06 | 0.08 | 0.06 | 0.08 | 0.07 | 0.01 |
| Montrezl Harrell | $6,000,000 | 0.06 | 0.09 | 0.12 | 0.11 | 0.11 | 0.11 | 0.05 |
| Jonathon Simmons | $6,000,000 | 0.06 | 0.07 | 0.08 | 0.07 | 0.07 | 0.07 | 0.01 |
| Ish Smith | $6,000,000 | 0.06 | 0.08 | 0.08 | 0.09 | 0.09 | 0.09 | 0.02 |
| Jaren Jackson | $5,915,040 | 0.06 | 0.05 | 0.05 | 0.05 | 0.05 | 0.05 | -0.01 |
| Brandon Ingram | $5,757,120 | 0.06 | 0.07 | 0.06 | 0.07 | 0.08 | 0.07 | 0.01 |
| Anthony Tolliver | $5,750,000 | 0.06 | 0.08 | 0.05 | 0.06 | 0.06 | 0.06 | 0.00 |
| De'Aaron Fox | $5,470,920 | 0.06 | 0.08 | 0.07 | 0.06 | 0.07 | 0.07 | 0.01 |
| Ben McLemore | $5,460,000 | 0.06 | 0.02 | 0.02 | 0.02 | 0.02 | 0.02 | -0.03 |
| Alex Abrines | $5,455,236 | 0.06 | 0.04 | 0.03 | 0.03 | 0.03 | 0.03 | -0.02 |
| Patrick Patterson | $5,451,600 | 0.06 | 0.04 | 0.04 | 0.05 | 0.04 | 0.04 | -0.01 |
| Jason Smith | $5,450,000 | 0.05 | 0.07 | 0.06 | 0.07 | 0.07 | 0.06 | 0.01 |
| Marcus Morris | $5,375,000 | 0.05 | 0.16 | 0.13 | 0.13 | 0.13 | 0.14 | 0.08 |
| Trae Young | $5,356,440 | 0.05 | 0.08 | 0.08 | 0.10 | 0.09 | 0.09 | 0.03 |
| DeMarcus Cousins | $5,337,000 | 0.05 | 0.19 | 0.23 | 0.23 | 0.22 | 0.22 | 0.17 |
| Thabo Sefolosha | $5,250,000 | 0.05 | 0.06 | 0.05 | 0.05 | 0.05 | 0.05 | 0.00 |
| Aron Baynes | $5,193,600 | 0.05 | 0.12 | 0.09 | 0.09 | 0.09 | 0.10 | 0.04 |
| Jaylen Brown | $5,169,960 | 0.05 | 0.05 | 0.05 | 0.05 | 0.05 | 0.05 | 0.00 |
| Patrick Beverley | $5,027,028 | 0.05 | 0.13 | 0.12 | 0.10 | 0.10 | 0.11 | 0.06 |
| Tony Parker | $5,000,000 | 0.05 | 0.06 | 0.09 | 0.07 | 0.07 | 0.07 | 0.02 |
| Mike Muscala | $5,000,000 | 0.05 | 0.05 | 0.06 | 0.07 | 0.06 | 0.06 | 0.01 |
| Dirk Nowitzki | $5,000,000 | 0.05 | 0.04 | 0.10 | 0.08 | 0.08 | 0.08 | 0.03 |
| Jonathan Isaac | $4,969,080 | 0.05 | 0.05 | 0.05 | 0.05 | 0.05 | 0.05 | 0.00 |
| Mohamed Bamba | $4,865,040 | 0.05 | 0.04 | 0.04 | 0.04 | 0.04 | 0.04 | -0.01 |
| Willie Cauley-Stein | $4,696,875 | 0.05 | 0.11 | 0.10 | 0.09 | 0.10 | 0.10 | 0.05 |
| Dragan Bender | $4,661,280 | 0.05 | 0.04 | 0.03 | 0.04 | 0.03 | 0.04 | -0.01 |
| Ron Baker | $4,544,400 | 0.05 | 0.01 | 0.01 | 0.02 | 0.02 | 0.01 | -0.03 |
| Lauri Markkanen | $4,536,120 | 0.05 | 0.08 | 0.07 | 0.07 | 0.07 | 0.07 | 0.03 |
| Lance Stephenson | $4,449,000 | 0.04 | 0.07 | 0.06 | 0.06 | 0.06 | 0.06 | 0.02 |
| Kyle O'Quinn | $4,449,000 | 0.04 | 0.05 | 0.06 | 0.05 | 0.05 | 0.05 | 0.01 |
| Ed Davis | $4,449,000 | 0.04 | 0.14 | 0.11 | 0.10 | 0.10 | 0.11 | 0.07 |
| Wendell Carter | $4,441,200 | 0.04 | 0.05 | 0.06 | 0.07 | 0.06 | 0.06 | 0.01 |
| Justin Holiday | $4,384,616 | 0.04 | 0.11 | 0.11 | 0.10 | 0.10 | 0.11 | 0.06 |
| Alex Len | $4,350,000 | 0.04 | 0.08 | 0.07 | 0.06 | 0.06 | 0.07 | 0.02 |
| Mike Scott | $4,320,500 | 0.04 | 0.07 | 0.07 | 0.07 | 0.07 | 0.07 | 0.03 |
| Luc Mbah a Moute | $4,320,500 | 0.04 | 0.06 | 0.05 | 0.06 | 0.06 | 0.06 | 0.01 |
| Emmanuel Mudiay | $4,294,480 | 0.04 | 0.07 | 0.05 | 0.06 | 0.06 | 0.06 | 0.02 |
| Kris Dunn | $4,221,000 | 0.04 | 0.05 | 0.06 | 0.08 | 0.09 | 0.07 | 0.03 |
| Frank Ntilikina | $4,155,720 | 0.04 | 0.03 | 0.03 | 0.03 | 0.04 | 0.03 | -0.01 |
| Glenn Robinson | $4,075,000 | 0.04 | 0.03 | 0.03 | 0.03 | 0.03 | 0.03 | -0.01 |
| Collin Sexton | $4,068,600 | 0.04 | 0.06 | 0.05 | 0.10 | 0.13 | 0.09 | 0.05 |
| Stanley Johnson | $3,940,402 | 0.04 | 0.03 | 0.03 | 0.04 | 0.04 | 0.03 | -0.01 |
| Buddy Hield | $3,833,760 | 0.04 | 0.16 | 0.19 | 0.17 | 0.17 | 0.17 | 0.13 |
| Dennis Smith | $3,819,960 | 0.04 | 0.05 | 0.06 | 0.07 | 0.07 | 0.06 | 0.02 |
| Kevin Knox | $3,739,920 | 0.04 | 0.06 | 0.07 | 0.06 | 0.06 | 0.06 | 0.03 |
| J.J. Barea | $3,710,850 | 0.04 | 0.15 | 0.13 | 0.11 | 0.12 | 0.13 | 0.09 |
| Zach Collins | $3,628,920 | 0.04 | 0.04 | 0.03 | 0.03 | 0.03 | 0.03 | 0.00 |
| Frank Kaminsky | $3,627,842 | 0.04 | 0.05 | 0.05 | 0.04 | 0.04 | 0.05 | 0.01 |
| Mikal Bridges | $3,552,960 | 0.04 | 0.02 | 0.03 | 0.03 | 0.03 | 0.03 | -0.01 |
| Michael Beasley | $3,500,000 | 0.04 | 0.06 | 0.07 | 0.07 | 0.07 | 0.07 | 0.03 |
| Jamal Murray | $3,499,800 | 0.04 | 0.06 | 0.06 | 0.07 | 0.08 | 0.07 | 0.03 |
| Rodney Hood | $3,472,887 | 0.04 | 0.07 | 0.06 | 0.05 | 0.05 | 0.06 | 0.02 |
| Jodie Meeks | $3,454,500 | 0.03 | 0.06 | 0.05 | 0.05 | 0.05 | 0.05 | 0.02 |
| Justise Winslow | $3,448,926 | 0.03 | 0.05 | 0.06 | 0.07 | 0.07 | 0.06 | 0.02 |
| Malik Monk | $3,447,480 | 0.03 | 0.03 | 0.03 | 0.03 | 0.03 | 0.03 | 0.00 |
| Myles Turner | $3,410,284 | 0.03 | 0.06 | 0.06 | 0.07 | 0.07 | 0.06 | 0.03 |
| Allonzo Trier | $3,382,000 | 0.03 | 0.05 | 0.04 | 0.04 | 0.04 | 0.04 | 0.01 |
| Brook Lopez | $3,382,000 | 0.03 | 0.15 | 0.17 | 0.16 | 0.16 | 0.16 | 0.13 |
| Shai Gilgeous-Alexander | $3,375,360 | 0.03 | 0.04 | 0.04 | 0.04 | 0.04 | 0.04 | 0.01 |
| Trey Lyles | $3,364,249 | 0.03 | 0.03 | 0.04 | 0.04 | 0.04 | 0.04 | 0.00 |
| Ekpe Udoh | $3,360,000 | 0.03 | 0.07 | 0.05 | 0.04 | 0.04 | 0.05 | 0.02 |
| Devin Booker | $3,314,365 | 0.03 | 0.18 | 0.12 | 0.11 | 0.13 | 0.14 | 0.10 |
| Luke Kennard | $3,275,280 | 0.03 | 0.03 | 0.03 | 0.03 | 0.03 | 0.03 | 0.00 |
| Cameron Payne | $3,263,295 | 0.03 | 0.02 | 0.03 | 0.03 | 0.03 | 0.03 | 0.00 |
| Troy Daniels | $3,258,539 | 0.03 | 0.04 | 0.04 | 0.04 | 0.04 | 0.04 | 0.01 |
| Kelly Oubre | $3,208,630 | 0.03 | 0.07 | 0.06 | 0.06 | 0.06 | 0.06 | 0.03 |
| Miles Bridges | $3,206,640 | 0.03 | 0.04 | 0.03 | 0.04 | 0.03 | 0.04 | 0.00 |
| Marquese Chriss | $3,206,160 | 0.03 | 0.03 | 0.03 | 0.03 | 0.03 | 0.03 | 0.00 |
| Tomas Satoransky | $3,129,187 | 0.03 | 0.06 | 0.07 | 0.07 | 0.06 | 0.07 | 0.04 |
| Bryn Forbes | $3,125,000 | 0.03 | 0.07 | 0.07 | 0.05 | 0.06 | 0.06 | 0.03 |
| Donovan Mitchell | $3,111,480 | 0.03 | 0.14 | 0.09 | 0.12 | 0.10 | 0.11 | 0.08 |
| Terry Rozier | $3,050,390 | 0.03 | 0.05 | 0.04 | 0.05 | 0.05 | 0.05 | 0.02 |
| Jerome Robinson | $3,046,200 | 0.03 | 0.02 | 0.02 | 0.02 | 0.02 | 0.02 | -0.01 |
| Yogi Ferrell | $3,000,000 | 0.03 | 0.03 | 0.03 | 0.03 | 0.03 | 0.03 | 0.00 |
| Elfrid Payton | $3,000,000 | 0.03 | 0.06 | 0.06 | 0.09 | 0.09 | 0.08 | 0.05 |
| Bam Adebayo | $2,955,840 | 0.03 | 0.05 | 0.05 | 0.04 | 0.04 | 0.04 | 0.02 |
| Justin Jackson | $2,807,880 | 0.03 | 0.03 | 0.03 | 0.03 | 0.03 | 0.03 | 0.00 |
| Thon Maker | $2,799,720 | 0.03 | 0.04 | 0.03 | 0.03 | 0.03 | 0.03 | 0.00 |
| Seth Curry | $2,795,000 | 0.03 | 0.06 | 0.04 | 0.04 | 0.04 | 0.05 | 0.02 |
| Cedi Osman | $2,775,000 | 0.03 | 0.06 | 0.04 | 0.05 | 0.05 | 0.05 | 0.02 |
| Sam Dekker | $2,760,095 | 0.03 | 0.04 | 0.03 | 0.03 | 0.03 | 0.03 | 0.01 |
| Troy Brown | $2,749,080 | 0.03 | 0.03 | 0.03 | 0.03 | 0.03 | 0.03 | 0.00 |
| Guerschon Yabusele | $2,667,600 | 0.03 | 0.02 | 0.02 | 0.01 | 0.01 | 0.02 | -0.01 |
| Justin Patton | $2,667,600 | 0.03 | 0.02 | 0.02 | 0.02 | 0.02 | 0.02 | -0.01 |
| Domantas Sabonis | $2,659,800 | 0.03 | 0.07 | 0.06 | 0.06 | 0.06 | 0.06 | 0.04 |
| Jerian Grant | $2,639,314 | 0.03 | 0.02 | 0.03 | 0.03 | 0.03 | 0.03 | 0.00 |
| Zhaire Smith | $2,611,800 | 0.03 | 0.04 | 0.03 | 0.03 | 0.03 | 0.03 | 0.00 |
| Delon Wright | $2,536,898 | 0.03 | 0.07 | 0.06 | 0.06 | 0.06 | 0.06 | 0.04 |
| D.J. Wilson | $2,534,280 | 0.03 | 0.04 | 0.04 | 0.04 | 0.04 | 0.04 | 0.01 |
| Dario Saric | $2,526,840 | 0.03 | 0.05 | 0.05 | 0.05 | 0.06 | 0.05 | 0.03 |
| Taurean Waller-Prince | $2,526,840 | 0.03 | 0.07 | 0.08 | 0.06 | 0.06 | 0.07 | 0.04 |
| Justin Anderson | $2,516,048 | 0.03 | 0.03 | 0.02 | 0.03 | 0.03 | 0.03 | 0.00 |
| Dante Cunningham | $2,500,000 | 0.03 | 0.07 | 0.05 | 0.05 | 0.05 | 0.06 | 0.03 |
| Reggie Bullock | $2,500,000 | 0.03 | 0.08 | 0.07 | 0.07 | 0.07 | 0.07 | 0.05 |
| Bobby Portis | $2,494,346 | 0.03 | 0.07 | 0.07 | 0.08 | 0.08 | 0.07 | 0.05 |
| Donte DiVincenzo | $2,481,000 | 0.03 | 0.02 | 0.02 | 0.02 | 0.02 | 0.02 | 0.00 |
| Rondae Hollis-Jefferson | $2,470,357 | 0.02 | 0.05 | 0.05 | 0.06 | 0.06 | 0.05 | 0.03 |
| Tyus Jones | $2,444,053 | 0.02 | 0.04 | 0.04 | 0.04 | 0.04 | 0.04 | 0.01 |
| Jarell Martin | $2,416,222 | 0.02 | 0.02 | 0.02 | 0.02 | 0.02 | 0.02 | -0.01 |
| T.J. Leaf | $2,407,560 | 0.02 | 0.02 | 0.02 | 0.01 | 0.01 | 0.02 | -0.01 |
| Jeff Green | $2,393,887 | 0.02 | 0.12 | 0.12 | 0.13 | 0.12 | 0.12 | 0.10 |
| Amir Johnson | $2,393,887 | 0.02 | 0.06 | 0.06 | 0.06 | 0.06 | 0.06 | 0.04 |
| Raymond Felton | $2,393,887 | 0.02 | 0.05 | 0.05 | 0.05 | 0.05 | 0.05 | 0.03 |
| Dwyane Wade | $2,393,887 | 0.02 | 0.17 | 0.19 | 0.16 | 0.17 | 0.17 | 0.15 |
| Udonis Haslem | $2,393,887 | 0.02 | 0.04 | 0.09 | 0.05 | 0.05 | 0.06 | 0.03 |
| JaVale McGee | $2,393,887 | 0.02 | 0.19 | 0.21 | 0.18 | 0.17 | 0.19 | 0.16 |
| Gerald Green | $2,393,887 | 0.02 | 0.11 | 0.09 | 0.08 | 0.08 | 0.09 | 0.07 |
| Andrew Bogut | $2,393,887 | 0.02 | 0.06 | 0.07 | 0.09 | 0.09 | 0.08 | 0.05 |
| Zaza Pachulia | $2,393,887 | 0.02 | 0.06 | 0.07 | 0.08 | 0.08 | 0.07 | 0.05 |
| Devin Harris | $2,393,887 | 0.02 | 0.06 | 0.05 | 0.05 | 0.05 | 0.05 | 0.03 |
| Channing Frye | $2,393,887 | 0.02 | 0.04 | 0.04 | 0.04 | 0.04 | 0.04 | 0.02 |
| Vince Carter | $2,393,887 | 0.02 | 0.04 | 0.07 | 0.07 | 0.06 | 0.06 | 0.04 |
| Jamal Crawford | $2,393,887 | 0.02 | 0.05 | 0.08 | 0.06 | 0.06 | 0.07 | 0.04 |
| Lonnie Walker | $2,357,160 | 0.02 | 0.02 | 0.02 | 0.02 | 0.01 | 0.02 | -0.01 |
| John Collins | $2,299,080 | 0.02 | 0.13 | 0.08 | 0.07 | 0.07 | 0.09 | 0.07 |
| Larry Nance | $2,272,391 | 0.02 | 0.06 | 0.07 | 0.09 | 0.09 | 0.08 | 0.05 |
| Kevin Huerter | $2,250,960 | 0.02 | 0.04 | 0.03 | 0.04 | 0.04 | 0.04 | 0.01 |
| Harry Giles | $2,207,040 | 0.02 | 0.03 | 0.03 | 0.04 | 0.04 | 0.04 | 0.01 |
| Darius Miller | $2,205,000 | 0.02 | 0.06 | 0.08 | 0.05 | 0.05 | 0.06 | 0.04 |
| Derrick Rose | $2,176,260 | 0.02 | 0.15 | 0.14 | 0.15 | 0.15 | 0.15 | 0.12 |
| Omri Casspi | $2,176,260 | 0.02 | 0.07 | 0.06 | 0.06 | 0.06 | 0.06 | 0.04 |
| Quincy Pondexter | $2,165,481 | 0.02 | 0.03 | 0.02 | 0.03 | 0.03 | 0.03 | 0.01 |
| Jonas Jerebko | $2,165,481 | 0.02 | 0.08 | 0.07 | 0.08 | 0.07 | 0.08 | 0.05 |
| Greg Monroe | $2,165,481 | 0.02 | 0.08 | 0.07 | 0.07 | 0.07 | 0.07 | 0.05 |
| Josh Okogie | $2,160,720 | 0.02 | 0.03 | 0.03 | 0.04 | 0.04 | 0.04 | 0.01 |
| Raul Neto | $2,150,000 | 0.02 | 0.02 | 0.03 | 0.03 | 0.03 | 0.03 | 0.01 |
| Terrance Ferguson | $2,118,840 | 0.02 | 0.03 | 0.03 | 0.02 | 0.02 | 0.03 | 0.01 |
| Grayson Allen | $2,074,320 | 0.02 | 0.02 | 0.02 | 0.02 | 0.02 | 0.02 | 0.00 |
| Jarrett Allen | $2,034,120 | 0.02 | 0.06 | 0.08 | 0.06 | 0.06 | 0.06 | 0.04 |
| Isaiah Thomas | $2,029,463 | 0.02 | 0.06 | 0.08 | 0.07 | 0.07 | 0.07 | 0.05 |
| Shelvin Mack | $2,029,463 | 0.02 | 0.06 | 0.07 | 0.06 | 0.06 | 0.06 | 0.04 |
| Torrey Craig | $2,000,000 | 0.02 | 0.06 | 0.07 | 0.07 | 0.06 | 0.07 | 0.05 |
| Corey Brewer | $2,000,000 | 0.02 | 0.06 | 0.06 | 0.06 | 0.06 | 0.06 | 0.04 |
| Chandler Hutchison | $1,991,520 | 0.02 | 0.04 | 0.03 | 0.03 | 0.03 | 0.03 | 0.01 |
| OG Anunoby | $1,952,760 | 0.02 | 0.03 | 0.03 | 0.03 | 0.03 | 0.03 | 0.01 |
| Ante Zizic | $1,952,760 | 0.02 | 0.04 | 0.03 | 0.03 | 0.03 | 0.04 | 0.02 |
| Shabazz Napier | $1,942,422 | 0.02 | 0.06 | 0.07 | 0.06 | 0.06 | 0.06 | 0.04 |
| Aaron Holiday | $1,911,960 | 0.02 | 0.02 | 0.02 | 0.02 | 0.03 | 0.02 | 0.00 |
| Tyler Lydon | $1,874,640 | 0.02 | 0.01 | 0.01 | 0.00 | 0.00 | 0.01 | -0.01 |
| Henry Ellenson | $1,857,480 | 0.02 | 0.03 | 0.03 | 0.03 | 0.03 | 0.03 | 0.01 |
| Anfernee Simons | $1,835,520 | 0.02 | 0.02 | 0.02 | 0.01 | 0.02 | 0.02 | 0.00 |
| Trey Burke | $1,795,015 | 0.02 | 0.07 | 0.05 | 0.06 | 0.06 | 0.06 | 0.04 |
| Malik Beasley | $1,773,840 | 0.02 | 0.04 | 0.04 | 0.03 | 0.03 | 0.04 | 0.02 |
| Moritz Wagner | $1,762,080 | 0.02 | 0.03 | 0.02 | 0.02 | 0.03 | 0.02 | 0.01 |
| Nerlens Noel | $1,757,429 | 0.02 | 0.03 | 0.03 | 0.04 | 0.04 | 0.03 | 0.02 |
| Ian Clark | $1,757,429 | 0.02 | 0.05 | 0.04 | 0.04 | 0.04 | 0.04 | 0.03 |
| Caleb Swanigan | $1,740,000 | 0.02 | 0.02 | 0.02 | 0.02 | 0.02 | 0.02 | 0.01 |
| Furkan Korkmaz | $1,740,000 | 0.02 | 0.03 | 0.02 | 0.02 | 0.02 | 0.03 | 0.01 |
| Landry Shamet | $1,703,640 | 0.02 | 0.03 | 0.03 | 0.02 | 0.02 | 0.03 | 0.01 |
| Caris LeVert | $1,702,800 | 0.02 | 0.07 | 0.08 | 0.07 | 0.07 | 0.08 | 0.06 |
| Jonah Bolden | $1,690,000 | 0.02 | 0.04 | 0.03 | 0.03 | 0.03 | 0.03 | 0.01 |
| Kyle Kuzma | $1,689,840 | 0.02 | 0.12 | 0.06 | 0.07 | 0.08 | 0.08 | 0.07 |
| Tony Bradley | $1,679,520 | 0.02 | 0.04 | 0.04 | 0.04 | 0.04 | 0.04 | 0.02 |
| Derrick White | $1,667,160 | 0.02 | 0.05 | 0.04 | 0.05 | 0.05 | 0.05 | 0.03 |
| Spencer Dinwiddie | $1,656,092 | 0.02 | 0.11 | 0.12 | 0.11 | 0.10 | 0.11 | 0.09 |
| MarShon Brooks | $1,656,092 | 0.02 | 0.05 | 0.04 | 0.05 | 0.05 | 0.05 | 0.03 |
| Josh Hart | $1,655,160 | 0.02 | 0.03 | 0.03 | 0.04 | 0.04 | 0.04 | 0.02 |
| Robert Williams | $1,654,440 | 0.02 | 0.03 | 0.03 | 0.02 | 0.02 | 0.02 | 0.01 |
| Jacob Evans | $1,644,240 | 0.02 | 0.02 | 0.01 | 0.01 | 0.01 | 0.01 | 0.00 |
| Pat Connaughton | $1,641,000 | 0.02 | 0.07 | 0.07 | 0.05 | 0.05 | 0.06 | 0.04 |
| DeAndre' Bembry | $1,634,640 | 0.02 | 0.05 | 0.04 | 0.05 | 0.04 | 0.05 | 0.03 |
| James Ennis | $1,621,415 | 0.02 | 0.06 | 0.05 | 0.05 | 0.05 | 0.05 | 0.04 |
| Noah Vonleh | $1,621,415 | 0.02 | 0.06 | 0.06 | 0.06 | 0.06 | 0.06 | 0.05 |
| Tim Frazier | $1,621,415 | 0.02 | 0.05 | 0.06 | 0.05 | 0.05 | 0.05 | 0.04 |
| Nik Stauskas | $1,621,415 | 0.02 | 0.04 | 0.03 | 0.03 | 0.03 | 0.03 | 0.02 |
| Omari Spellman | $1,620,480 | 0.02 | 0.04 | 0.04 | 0.04 | 0.03 | 0.04 | 0.02 |
| Luke Kornet | $1,619,000 | 0.02 | 0.03 | 0.03 | 0.04 | 0.04 | 0.03 | 0.02 |
| Rodions Kurucs | $1,618,320 | 0.02 | 0.04 | 0.03 | 0.04 | 0.03 | 0.04 | 0.02 |
| Richaun Holmes | $1,600,520 | 0.02 | 0.05 | 0.06 | 0.05 | 0.05 | 0.05 | 0.04 |
| T.J. McConnell | $1,600,520 | 0.02 | 0.04 | 0.04 | 0.04 | 0.04 | 0.04 | 0.02 |
| Malachi Richardson | $1,569,360 | 0.02 | 0.01 | 0.01 | 0.01 | 0.01 | 0.01 | 0.00 |
| Jahlil Okafor | $1,567,007 | 0.02 | 0.04 | 0.03 | 0.03 | 0.03 | 0.04 | 0.02 |
| Kevon Looney | $1,567,007 | 0.02 | 0.03 | 0.04 | 0.03 | 0.03 | 0.03 | 0.01 |
| Salah Mejri | $1,567,007 | 0.02 | 0.07 | 0.07 | 0.08 | 0.08 | 0.07 | 0.06 |
| Pascal Siakam | $1,544,951 | 0.02 | 0.09 | 0.12 | 0.12 | 0.11 | 0.11 | 0.10 |
| Damian Jones | $1,544,951 | 0.02 | 0.03 | 0.02 | 0.02 | 0.02 | 0.02 | 0.01 |
| Deyonta Davis | $1,544,951 | 0.02 | 0.03 | 0.03 | 0.02 | 0.02 | 0.02 | 0.01 |
| Jake Layman | $1,544,951 | 0.02 | 0.03 | 0.03 | 0.03 | 0.03 | 0.03 | 0.02 |
| Cheick Diallo | $1,544,951 | 0.02 | 0.04 | 0.04 | 0.03 | 0.03 | 0.03 | 0.02 |
| Malcolm Brogdon | $1,544,951 | 0.02 | 0.13 | 0.13 | 0.11 | 0.12 | 0.12 | 0.11 |
| Rodney McGruder | $1,544,951 | 0.02 | 0.06 | 0.07 | 0.07 | 0.07 | 0.07 | 0.05 |
| Ivica Zubac | $1,544,951 | 0.02 | 0.05 | 0.05 | 0.04 | 0.05 | 0.05 | 0.03 |
| Wade Baldwin | $1,544,951 | 0.02 | 0.01 | 0.02 | 0.02 | 0.02 | 0.02 | 0.00 |
| Quinn Cook | $1,544,951 | 0.02 | 0.04 | 0.04 | 0.03 | 0.03 | 0.04 | 0.02 |
| Dorian Finney-Smith | $1,544,951 | 0.02 | 0.06 | 0.05 | 0.06 | 0.06 | 0.06 | 0.04 |
| Wayne Selden | $1,544,951 | 0.02 | 0.03 | 0.03 | 0.04 | 0.04 | 0.03 | 0.02 |
| Georges Niang | $1,512,601 | 0.02 | 0.03 | 0.02 | 0.02 | 0.02 | 0.02 | 0.01 |
| Christian Wood | $1,512,601 | 0.02 | 0.05 | 0.03 | 0.03 | 0.03 | 0.03 | 0.02 |
| Derrick Jones | $1,512,601 | 0.02 | 0.04 | 0.03 | 0.04 | 0.03 | 0.04 | 0.02 |
| David Nwaba | $1,512,601 | 0.02 | 0.05 | 0.04 | 0.05 | 0.04 | 0.04 | 0.03 |
| Treveon Graham | $1,512,601 | 0.02 | 0.05 | 0.05 | 0.05 | 0.04 | 0.05 | 0.03 |
| Sviatoslav Mykhailiuk | $1,487,694 | 0.02 | 0.02 | 0.02 | 0.01 | 0.01 | 0.02 | 0.00 |
| Mitchell Robinson | $1,485,440 | 0.01 | 0.04 | 0.06 | 0.05 | 0.05 | 0.05 | 0.04 |
| Jordan Bell | $1,378,252 | 0.01 | 0.02 | 0.03 | 0.03 | 0.03 | 0.03 | 0.02 |
| Frank Jackson | $1,378,242 | 0.01 | 0.04 | 0.03 | 0.03 | 0.03 | 0.03 | 0.02 |
| Thomas Bryant | $1,378,242 | 0.01 | 0.05 | 0.06 | 0.05 | 0.05 | 0.05 | 0.04 |
| Royce O'Neale | $1,378,242 | 0.01 | 0.02 | 0.04 | 0.03 | 0.03 | 0.03 | 0.02 |
| Frank Mason | $1,378,242 | 0.01 | 0.02 | 0.02 | 0.02 | 0.02 | 0.02 | 0.01 |
| Davon Reed | $1,378,242 | 0.01 | 0.01 | 0.01 | 0.01 | 0.01 | 0.01 | 0.00 |
| Wesley Iwundu | $1,378,242 | 0.01 | 0.03 | 0.03 | 0.03 | 0.03 | 0.03 | 0.02 |
| Khem Birch | $1,378,242 | 0.01 | 0.05 | 0.05 | 0.04 | 0.05 | 0.05 | 0.03 |
| Abdel Nader | $1,378,242 | 0.01 | 0.03 | 0.03 | 0.03 | 0.02 | 0.03 | 0.01 |
| Damyean Dotson | $1,378,242 | 0.01 | 0.06 | 0.04 | 0.05 | 0.05 | 0.05 | 0.04 |
| Sterling Brown | $1,378,242 | 0.01 | 0.03 | 0.03 | 0.03 | 0.03 | 0.03 | 0.01 |
| Dillon Brooks | $1,378,242 | 0.01 | 0.03 | 0.03 | 0.03 | 0.03 | 0.03 | 0.01 |
| Tyler Dorsey | $1,378,242 | 0.01 | 0.03 | 0.03 | 0.03 | 0.03 | 0.03 | 0.01 |
| Ivan Rabb | $1,378,242 | 0.01 | 0.03 | 0.03 | 0.02 | 0.02 | 0.03 | 0.01 |
| Jawun Evans | $1,378,242 | 0.01 | 0.01 | 0.01 | 0.01 | 0.01 | 0.01 | 0.00 |
| Sindarius Thornwell | $1,378,242 | 0.01 | 0.02 | 0.02 | 0.01 | 0.02 | 0.02 | 0.00 |
| Ike Anigbogu | $1,378,242 | 0.01 | 0.01 | 0.02 | 0.02 | 0.01 | 0.02 | 0.00 |
| Maxi Kleber | $1,378,242 | 0.01 | 0.06 | 0.08 | 0.07 | 0.07 | 0.07 | 0.06 |
| Dwayne Bacon | $1,378,242 | 0.01 | 0.02 | 0.03 | 0.02 | 0.02 | 0.02 | 0.01 |
| Semi Ojeleye | $1,378,242 | 0.01 | 0.01 | 0.02 | 0.02 | 0.02 | 0.02 | 0.00 |
| Daniel Theis | $1,378,242 | 0.01 | 0.04 | 0.04 | 0.04 | 0.04 | 0.04 | 0.03 |
| Monte Morris | $1,349,383 | 0.01 | 0.04 | 0.03 | 0.04 | 0.03 | 0.03 | 0.02 |
| Antonio Blakeney | $1,349,383 | 0.01 | 0.03 | 0.03 | 0.03 | 0.04 | 0.04 | 0.02 |
| Tyrone Wallace | $1,349,383 | 0.01 | 0.02 | 0.03 | 0.02 | 0.02 | 0.02 | 0.01 |
| Alfonzo McKinnie | $1,349,383 | 0.01 | 0.05 | 0.05 | 0.04 | 0.04 | 0.05 | 0.03 |
| Ryan Arcidiacono | $1,349,383 | 0.01 | 0.04 | 0.03 | 0.03 | 0.02 | 0.03 | 0.02 |
| Daniel Hamilton | $1,349,383 | 0.01 | 0.02 | 0.02 | 0.02 | 0.02 | 0.02 | 0.01 |
| Shaquille Harrison | $1,311,265 | 0.01 | 0.05 | 0.05 | 0.05 | 0.05 | 0.05 | 0.04 |
| Elie Okobo | $1,238,464 | 0.01 | 0.02 | 0.02 | 0.03 | 0.04 | 0.03 | 0.02 |
| Jalen Brunson | $1,230,000 | 0.01 | 0.03 | 0.03 | 0.03 | 0.03 | 0.03 | 0.02 |
| Michael Carter-Williams | $1,200,000 | 0.01 | 0.05 | 0.07 | 0.05 | 0.06 | 0.06 | 0.05 |
| Melvin Frazier | $1,050,000 | 0.01 | 0.01 | 0.01 | 0.01 | 0.01 | 0.01 | 0.00 |
| Isaac Bonga | $1,000,000 | 0.01 | 0.02 | 0.02 | 0.01 | 0.01 | 0.02 | 0.01 |
| Devonte' Graham | $988,464 | 0.01 | 0.03 | 0.02 | 0.03 | 0.03 | 0.03 | 0.02 |
| De'Anthony Melton | $949,000 | 0.01 | 0.03 | 0.03 | 0.04 | 0.04 | 0.03 | 0.02 |
| Chasson Randle | $869,094 | 0.01 | 0.03 | 0.03 | 0.03 | 0.03 | 0.03 | 0.02 |
| Gary Trent | $838,464 | 0.01 | 0.02 | 0.02 | 0.01 | 0.02 | 0.02 | 0.01 |
| Hamidou Diallo | $838,464 | 0.01 | 0.02 | 0.02 | 0.02 | 0.02 | 0.02 | 0.01 |
| Keita Bates-Diop | $838,464 | 0.01 | 0.02 | 0.03 | 0.03 | 0.03 | 0.03 | 0.02 |
| Jevon Carter | $838,464 | 0.01 | 0.02 | 0.02 | 0.03 | 0.03 | 0.03 | 0.02 |
| Bruce Brown | $838,464 | 0.01 | 0.02 | 0.03 | 0.03 | 0.03 | 0.03 | 0.02 |
| Jarred Vanderbilt | $838,464 | 0.01 | 0.02 | 0.02 | 0.02 | 0.02 | 0.02 | 0.01 |
| Khyri Thomas | $838,464 | 0.01 | 0.02 | 0.02 | 0.01 | 0.01 | 0.02 | 0.01 |
| Isaiah Briscoe | $838,464 | 0.01 | 0.01 | 0.02 | 0.02 | 0.02 | 0.02 | 0.01 |
| Chimezie Metu | $838,464 | 0.01 | 0.02 | 0.02 | 0.02 | 0.02 | 0.02 | 0.01 |
| Kenrich Williams | $838,464 | 0.01 | 0.04 | 0.04 | 0.05 | 0.05 | 0.05 | 0.04 |
| Alize Johnson | $838,464 | 0.01 | 0.01 | 0.02 | 0.02 | 0.02 | 0.02 | 0.01 |
| Isaiah Hartenstein | $838,464 | 0.01 | 0.02 | 0.02 | 0.02 | 0.01 | 0.02 | 0.01 |
| Ray Spalding | $838,464 | 0.01 | 0.03 | 0.03 | 0.03 | 0.03 | 0.03 | 0.02 |
| Ryan Broekhoff | $838,464 | 0.01 | 0.04 | 0.03 | 0.02 | 0.03 | 0.03 | 0.02 |
| Brad Wanamaker | $838,464 | 0.01 | 0.05 | 0.04 | 0.03 | 0.03 | 0.04 | 0.03 |
| Lorenzo Brown | $800,000 | 0.01 | 0.03 | 0.04 | 0.03 | 0.04 | 0.03 | 0.02 |
| Patrick McCaw | $786,000 | 0.01 | 0.01 | 0.02 | 0.02 | 0.02 | 0.02 | 0.01 |
| James Nunnally | $655,632 | 0.01 | 0.02 | 0.02 | 0.03 | 0.03 | 0.02 | 0.02 |
| Zhou Qi | $506,134 | 0.01 | 0.01 | 0.01 | 0.00 | 0.01 | 0.01 | 0.00 |
| Bruno Caboclo | $487,000 | 0.00 | 0.04 | 0.04 | 0.04 | 0.04 | 0.04 | 0.03 |
| Chris Boucher | $457,418 | 0.00 | 0.03 | 0.03 | 0.03 | 0.03 | 0.03 | 0.02 |
| Malcolm Miller | $457,418 | 0.00 | 0.02 | 0.02 | 0.02 | 0.01 | 0.02 | 0.01 |
| Isaiah Canaan | $456,733 | 0.00 | 0.04 | 0.04 | 0.04 | 0.04 | 0.04 | 0.04 |
| Edmond Sumner | $449,794 | 0.00 | 0.02 | 0.02 | 0.02 | 0.01 | 0.02 | 0.01 |
| Nick Young | $311,070 | 0.00 | 0.05 | 0.03 | 0.05 | 0.05 | 0.04 | 0.04 |
| Okaro White | $264,919 | 0.00 | 0.02 | 0.01 | 0.02 | 0.02 | 0.02 | 0.01 |
| Eric Moreland | $239,035 | 0.00 | 0.04 | 0.05 | 0.05 | 0.04 | 0.05 | 0.05 |
| Jaylen Adams | $236,854 | 0.00 | 0.02 | 0.02 | 0.02 | 0.02 | 0.02 | 0.01 |
| Quincy Acy | $213,949 | 0.00 | 0.05 | 0.06 | 0.05 | 0.05 | 0.05 | 0.05 |
| Andrew Harrison | $200,000 | 0.00 | 0.02 | 0.02 | 0.02 | 0.02 | 0.02 | 0.02 |
| Jimmer Fredette | $198,580 | 0.00 | 0.05 | 0.05 | 0.05 | 0.04 | 0.05 | 0.05 |
| Terrence Jones | $198,580 | 0.00 | 0.03 | 0.05 | 0.03 | 0.03 | 0.04 | 0.03 |
| Dairis Bertans | $194,220 | 0.00 | 0.04 | 0.03 | 0.04 | 0.04 | 0.04 | 0.03 |
| Troy Williams | $122,741 | 0.00 | 0.03 | 0.03 | 0.03 | 0.03 | 0.03 | 0.03 |
| Cameron Reynolds | $108,953 | 0.00 | 0.02 | 0.02 | 0.01 | 0.01 | 0.02 | 0.02 |
| Tyler Zeller | $106,974 | 0.00 | 0.09 | 0.08 | 0.07 | 0.07 | 0.08 | 0.08 |
| John Jenkins | $99,290 | 0.00 | 0.04 | 0.04 | 0.03 | 0.04 | 0.04 | 0.04 |
| Mitch Creek | $94,742 | 0.00 | 0.03 | 0.02 | 0.03 | 0.03 | 0.03 | 0.03 |
| B.J. Johnson | $94,742 | 0.00 | 0.02 | 0.01 | 0.01 | 0.01 | 0.01 | 0.01 |
| Demetrius Jackson | $92,857 | 0.00 | 0.02 | 0.01 | 0.01 | 0.01 | 0.01 | 0.01 |
| Chris Chiozza | $90,005 | 0.00 | 0.01 | 0.01 | 0.01 | 0.01 | 0.01 | 0.01 |
| Gary Payton | $85,458 | 0.00 | 0.02 | 0.02 | 0.02 | 0.02 | 0.02 | 0.02 |
| Andre Ingram | $76,236 | 0.00 | 0.04 | 0.03 | 0.04 | 0.04 | 0.04 | 0.04 |
| Kobi Simmons | $76,236 | 0.00 | 0.01 | 0.01 | 0.01 | 0.01 | 0.01 | 0.01 |
| Emanuel Terry | $47,371 | 0.00 | 0.02 | 0.02 | 0.01 | 0.01 | 0.02 | 0.01 |
| Dusty Hannahs | $47,371 | 0.00 | 0.02 | 0.03 | 0.03 | 0.02 | 0.03 | 0.03 |
| Scott Machado | $47,371 | 0.00 | 0.02 | 0.02 | 0.02 | 0.02 | 0.02 | 0.02 |
| Tahjere McCall | $47,371 | 0.00 | 0.02 | 0.02 | 0.01 | 0.01 | 0.01 | 0.01 |
| Jordan Sibert | $47,371 | 0.00 | 0.02 | 0.03 | 0.01 | 0.01 | 0.02 | 0.02 |
The table below shows the sum of salary difference for each team.
| Team | Expected - actual salary |
|---|---|
| OKC | -0.301127239 |
| DET | -0.196558684 |
| POR | -0.188727998 |
| CLE | -0.165025893 |
| CHO | -0.164026887 |
| BOS | -0.140433314 |
| MEM | -0.127108595 |
| DEN | -0.115326016 |
| MIA | -0.104270679 |
| CHI | -0.10426104 |
| NYK | -0.097740689 |
| TOR | -0.082138834 |
| HOU | -0.070111489 |
| ORL | -0.027763124 |
| WAS | -0.002298575 |
| MIN | 0.01019517 |
| UTA | 0.014369528 |
| GSW | 0.053085693 |
| IND | 0.057189813 |
| SAS | 0.077944249 |
| SAC | 0.112919098 |
| ATL | 0.13747969 |
| PHO | 0.162973555 |
| MIL | 0.242080721 |
| LAC | 0.24972236 |
| PHI | 0.252459516 |
| BRK | 0.264243327 |
| NOP | 0.283361038 |
| LAL | 0.291198454 |
| DAL | 0.337323327 |
Interactive results
To help visualize the results, we created an R Shiny app. This lets you interactively compare players and teams. The link is:
http://dribbleanalytics.shinyapps.io/contract-value/
Why do the models predict what they do?
Now that we’ve seen the performance and results of the model, we’ll look at what influences their prediction. To do this, we’ll use Shapley values. Shapley value estimates the marginal contribution of a feature through all possible combinations. This allows us to see what features are most important, and what values for these features create the most impact. For example, we know that a low value for age will result in a low predicted salary because of rookie contracts. But, is age a big predictor of salary in all cases? Or does it only matter for young players, after which other factors matter more?
Shapley values let us answer these questions. The four graphs below show the Shapley values for each feature in our four models. The y-axis sorts features by their importance (most important is on top). The x-axis shows the Shapley value, or the impact on model output. The color of each point shows the actual feature value. So, for example, older players have red “age” points, because their age is higher.
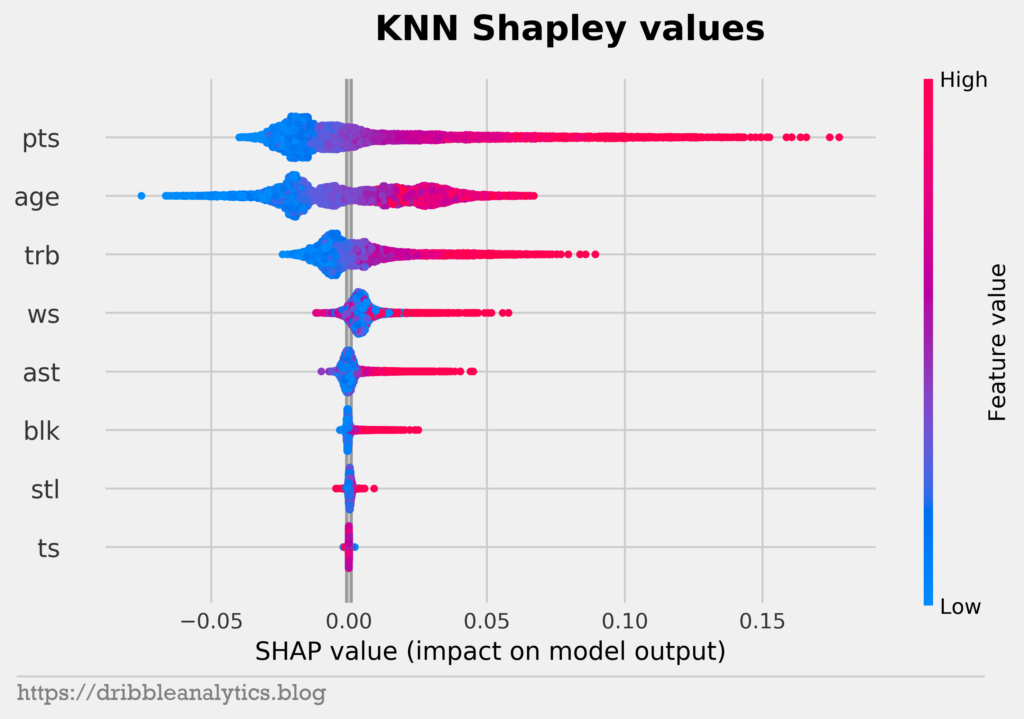
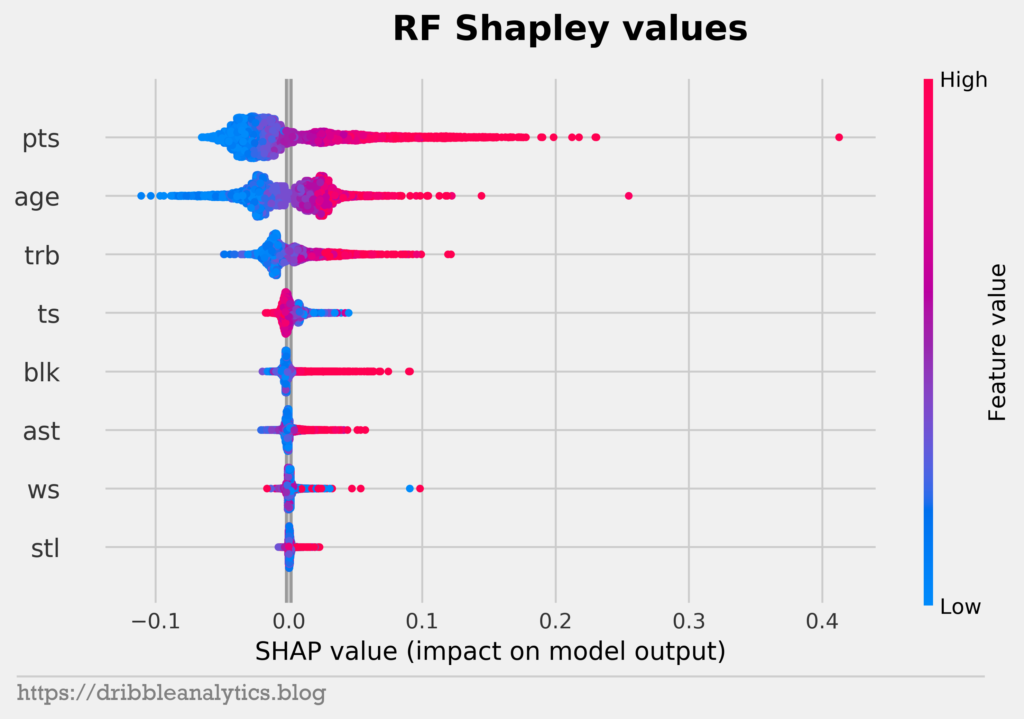
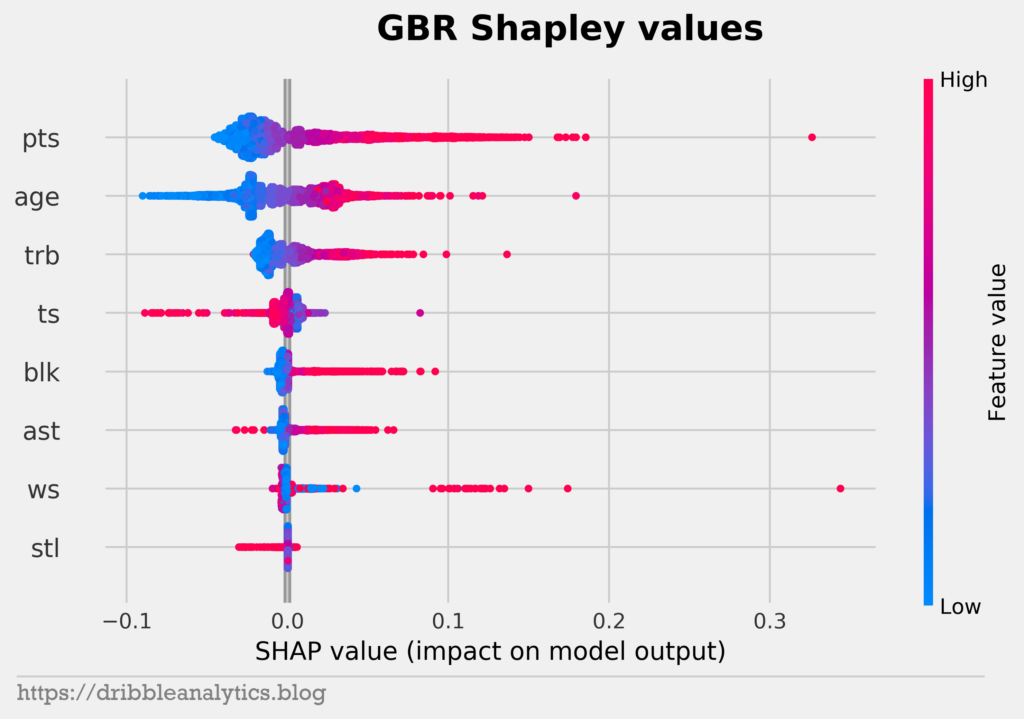
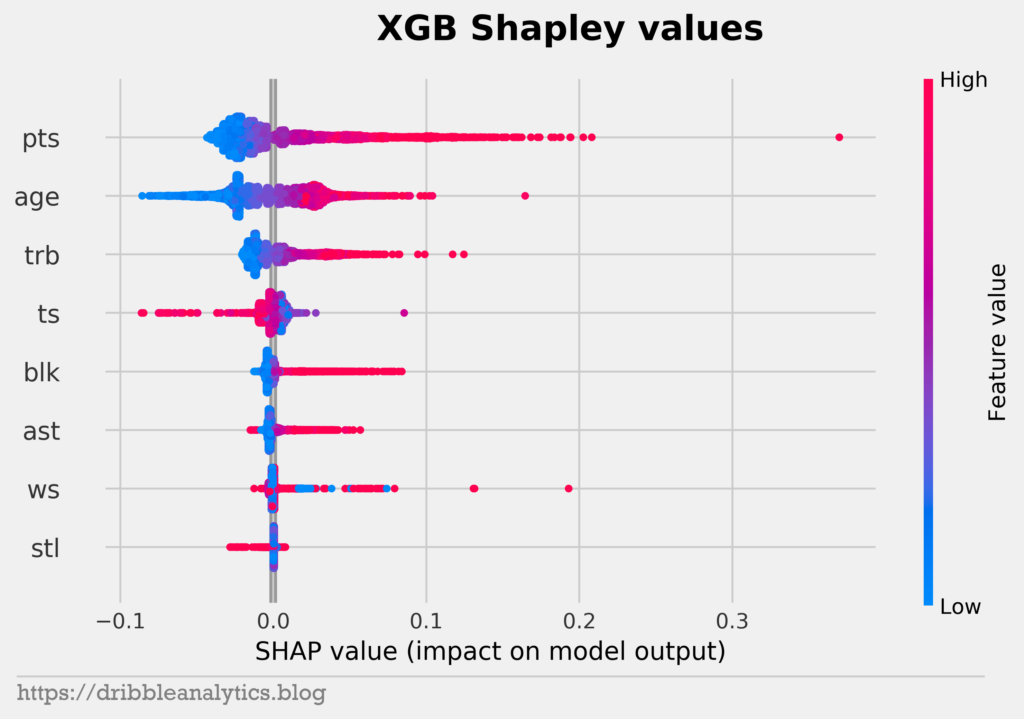
All four models have points, age, and rebounds as their top 3 features in that order. Notice that the feature importance for the RF, GBR, and XGB follow the same order. Because all three of these models are tree-based models, they fit the data in similar ways. So, the same feature sets affect the models to a similar extent.
We see that rebounds don’t have much of an effect on model output unless the player recorded a lot of rebounds. This makes sense, as most top bigs will rack up rebounds. Meanwhile, guards and wings won’t record lots of rebounds, but that shouldn’t affect them.
The plots give more proof to the effect of rookie contracts and age. In each model, low values of age have the largest negative impact on model output. But, there’s an interesting trend with high values of age. We’d expect high values of age not to affect output, given that older players often earn less because they’re expected to decline. However, high values of age positively impact model outputs. This explains some of the odd results of the models, such as why LaMarcus Aldridge has a higher predicted salary than Giannis.
Conclusion
When offering players contracts, GMs try to give better players more money. By giving models basic indicators of player performance, we can almost pinpoint what a player should earn.
We could expand this to predict a player’s salary in year n given their performance in year n – 1. This allows us to predict how much a player should earn before they start their contract or pick their team. However, this analysis would be much less accurate than what we did here. It’s hard to predict how players will progress between seasons or how different schemes affect their production. Over one summer, so much changes. In the course of a single season, player performance is much easier to predict. So, this works because it’s a retrospective look at value, instead of a future prediction.