In 1985, the NBA instituted a draft lottery to prevent teams from “tanking,” or throwing games to earn a higher draft pick. Before 1985, the worst teams in both conferences received picks in corresponding order based off a coin flip.
This rule change came after the Rockets pulled off an infamous tank job for the #1 pick. After starting the season 20-26, the Rockets went 9-27 due to some questionable rotations.
The Rockets only had the fourth worst record that year, but the three worst records were all in the east. The coin flip gave them the #1 pick over the Indiana Pacers, which they used to select Hakeem Olajuwon.
With the rise of analytics, tanking has become more and more popular. Most recently, Sam Hinkie orchestrated an incredible tank job which resulted in drafting Joel Embiid and Ben Simmons while collecting tons of assets which enabled them to trade for Jimmy Butler and Tobias Harris. Given Hinkie’s success, but the failure of other tank jobs, many debate whether tanking is “worth it.”
The flaw in current tanking analyses
Most analyses try to answer the tanking question in a similar way. They start by saying comparing some metric among each pick in the lottery, whether it’s average win shares or percentage of players picked in that spot who become All-Stars.
Using this percentage, they adjust for things such as the likelihood the drafted player reaches an All-Star team with the team that drafts him.
They almost always conclude that tanking is worth it because as you pick higher in the draft, you have a higher chance of selecting a better player. Therefore, if you tank for many years, you are more likely than not to draft an All-Star/player above the threshold deemed necessary to help a team win.
But, these analyses have their flaws. When a team picks high, they’re not selecting “player with x win shares” or “player with x likelihood of being an All-Star.” They’re selecting real players with tons of randomness involved. Otherwise, the player drafted first would always have the highest win shares in the draft, second would have the second highest, etc. Once a player is drafted, lots of other factors come into the equation.
For example, player development, situation, and coaching all matter significantly. Though historically x% of players draft in a spot become All-Stars, we would all bet that a Spurs pick at that spot has a higher chance of being an All-Star than a Suns pick. Furthermore, though Devin Booker wasn’t necessarily a result of tanking (as he was picked 13th), many would define him as a great pick. Yet, the Suns have won a maximum of 24 games in his 4 years on the roster.
The reality is that a 76ers-esque transition from tanking to contenders is essentially unheard-of. A mix of excellent drafting, injuries, and smart signings put the 76ers in that position. A team will almost never go from being bad enough to contender status in a few years.
This “transition” from being a tanking team to eventual contenders is where Markov chains come in.
What is a Markov chain
A Markov chain analyzes a sequence of events where the probability of the next event depends only on the current state. The classic example of a Markov chain is the weather.
Let’s say that we describe the weather in one of three ways, or “states”: sunny, cloudy, and rainy. We know the probability of it being cloudy tomorrow if it’s sunny today, rainy tomorrow if cloudy today, cloudy tomorrow if cloudy today, etc.
This table shows the probabilities of all possible combinations, or the “transition probability.” The first column describes the current state, and the first row describes the next state. So, the right-most value in the first row describes the probability that it will rain tomorrow if it’s sunny today.
| Sunny | Cloudy | Rainy | |
|---|---|---|---|
| Sunny | 0.7 | 0.2 | 0.1 |
| Cloudy | 0.3 | 0.5 | 0.2 |
| Rainy | 0.2 | 0.4 | 0.4 |
The chain looks like this:
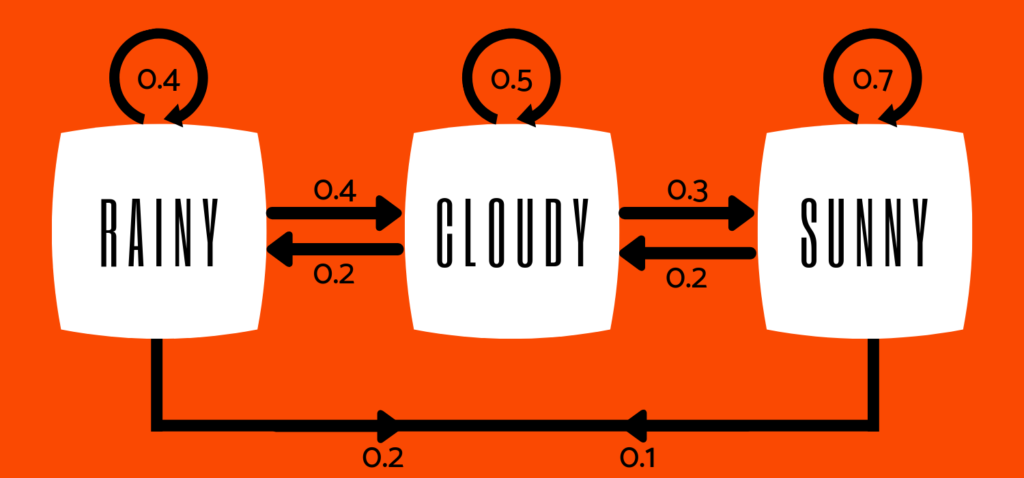
Now let’s say we wanted to know how likely it is to rain two days from now if it’s sunny today.
There are three possible ways we can get from sunny to rainy in two days:
- Day 1: stays sunny (sunny-sunny). Day 2: switches to rainy (sunny-rainy)
- Day 1: switches to cloudy (sunny-cloudy). Day 2: switches to rainy (cloudy-rainy)
- Day 1: switches to rainy (sunny-rainy). Day 2: stays rainy (rainy-rainy)
Because we know all the transition probabilities, we can calculate this probability by multiplying each possible combo’s day 1 and day 2 values, then adding the possible combos.
So, the probability it rains in two days = (0.7) * (0.1) + (0.2) * (0.2) + (0.1) * (0.4) = 0.15, or a 15% chance.
A 3-state Markov chain for tanking
Instead of predicting the weather, let’s predict a team’s probability of making the playoffs. Though many tanking analyses describe the goal of tanking is to win a championship, a playoff berth is still a success. Furthermore, for many teams, making the playoffs is a much more attainable goal than winning the finals, and the owner will still be happy with the playoffs. Therefore, we’re describing the GM’s goal as making the playoffs.
Our three states describe a team’s place in the standings. They are: bottom 5, lottery, and playoffs. Using every season from 1985-2018, I calculated the transition probabilities for each of the three states to create the Markov chain.
The table below shows the transition probabilities:
| Bottom five | Lottery | Playoffs | |
|---|---|---|---|
| Bottom five | 0.48 | 0.38 | 0.14 |
| Lottery | 0.21 | 0.38 | 0.41 |
| Playoffs | 0.05 | 0.18 | 0.77 |
Visually, the chain looks like this:
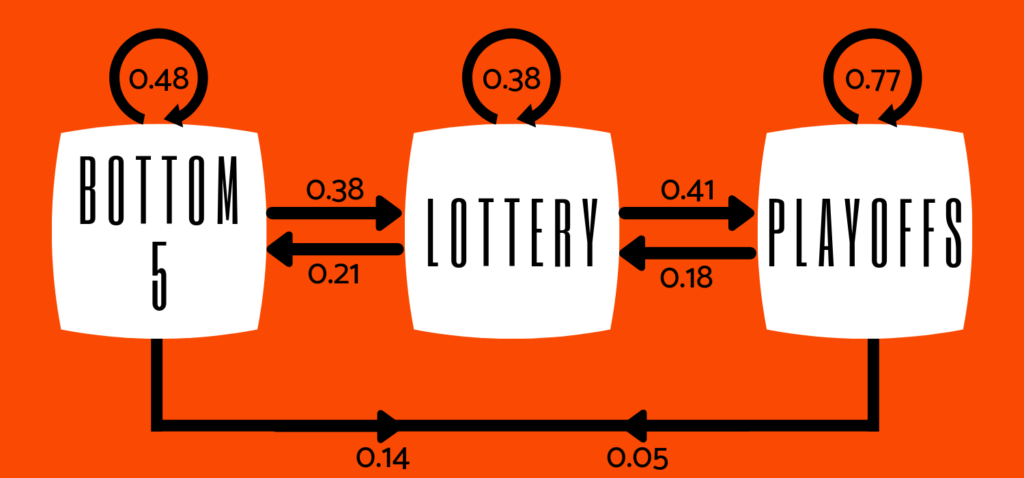
This goes to show how unlikely it is that a team will follow a path like the 76ers. Since 1985, only 14% of teams went from being a bottom five team to the playoffs the next year.
Using the same method we described for predicting weather earlier, we can measure the likelihood a team will make the playoffs if they start from the bottom five compared to if they start from the lottery.
I ran 100,000 simulations of the above Markov chain to see the probability a team makes the playoffs from those two states within five years. The graph below shows the results.
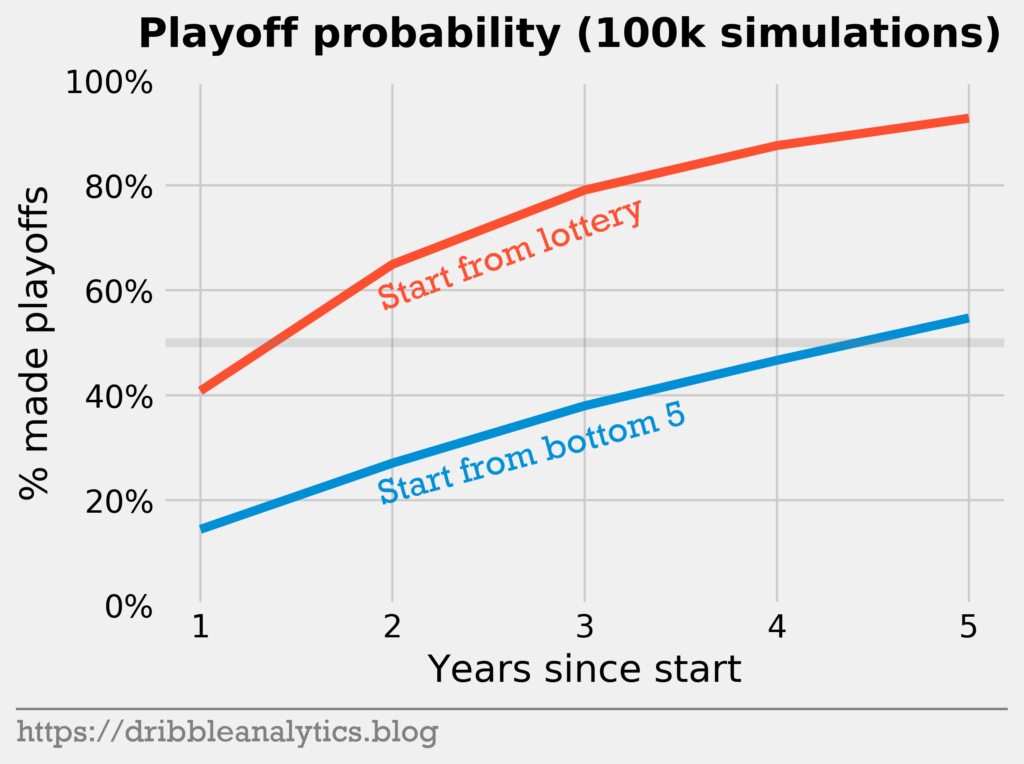
In the second year, the team starting in the lottery already has a greater-than-60% chance of making the playoffs. Meanwhile, the bottom five team crosses 50% only in the fifth and final year. This may be more time than an impatient owner will give a GM, making tanking not a viable option in this case.
Let’s see if we give the GM even more time.
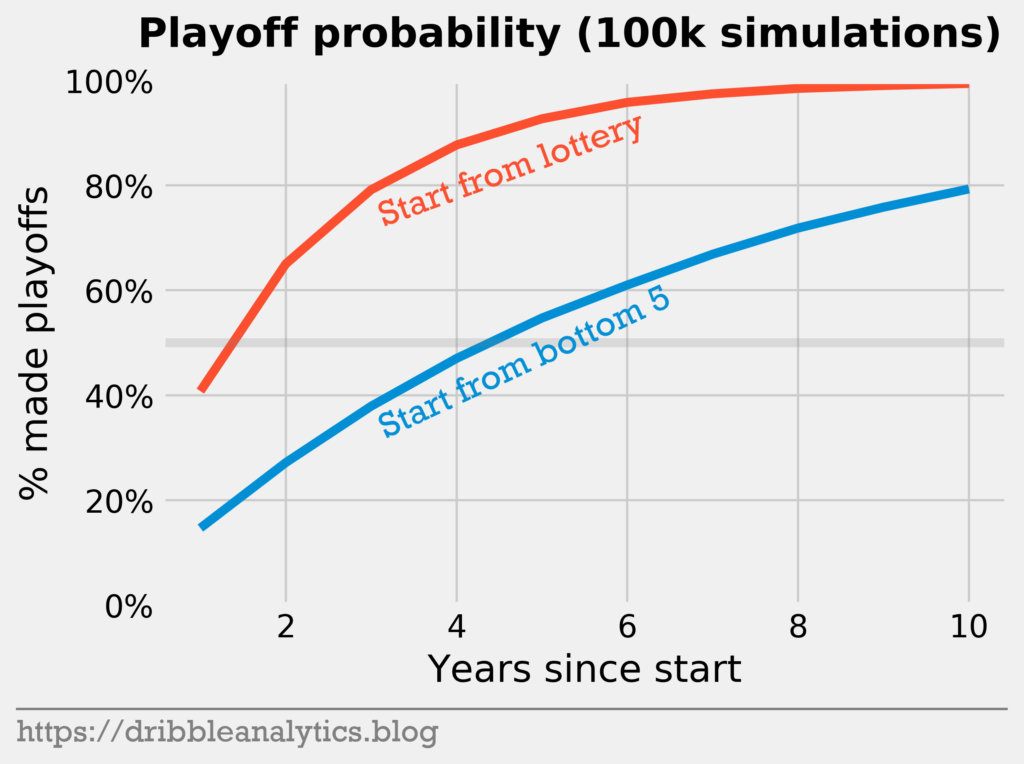
Within 10 years, the bottom five team has an 80% chance of making the playoffs, while the lottery team essentially has a 100% chance.
However, this specific Markov chain has one issue. The data starts in 1985, when the league had only 23 teams. Therefore, a bottom five team was just a few spots away from a playoff berth, and a lottery team was at most two spots out.
Furthermore, there are different “levels” of tanking; there’s the hard rebuild of going for a top five pick, and a softer rebuild of going for a pick in the 6-10 range.
To account for these factors, let’s try a 4-state Markov chain.
4-state Markov chain
For the 4-state Markov chain, we’ll only use data starting from 2005, when the league had 30 teams. Therefore, there’s more separation between tanking teams and the rest and we can differentiate between the different types of tanking.
Our four states will be:
- Bottom five
- 6-10
- 11-14
- Playoffs
So, we’ll compare the likelihood that a bottom five, 6-10, and 11-14 team makes the playoffs.
A 4-state Markov chain is harder to visualize than a 3-state chain, given that there are 16 transitions (compared to 9 for a 3-state chain). Instead of visualizing it and looking at the transition probabilities, let’s just look at the transition probabilities.
| Bottom five | 6-10 | 11-14 | Playoffs | |
|---|---|---|---|---|
| Bottom five | 0.49 | 0.28 | 0.09 | 0.14 |
| 6-10 | 0.18 | 0.34 | 0.15 | 0.32 |
| 11-14 | 0.17 | 0.13 | 0.25 | 0.44 |
| Playoffs | 0.06 | 0.09 | 0.11 | 0.75 |
Interestingly, the bottom five and 6-10 are most likely to end up in the same state next year, while the 11-14 teams’ most likely outcome is moving up into the playoffs.
The graph below shows 100,000 simulations of the 4-state Markov chain from each of these starting points.
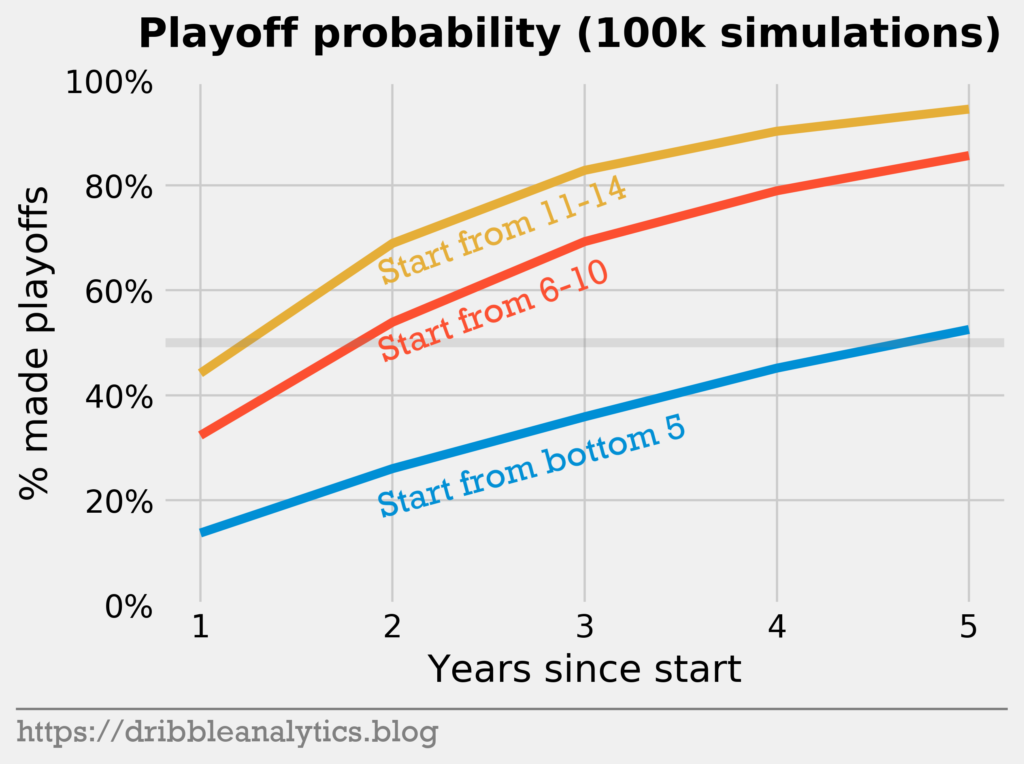
In the fifth year, the teams starting from 6-10 and 11-14 have a playoff probability over 80%. However, the bottom five teams barely eclipse 50%.
The graph below extends this simulation from five years to ten years.
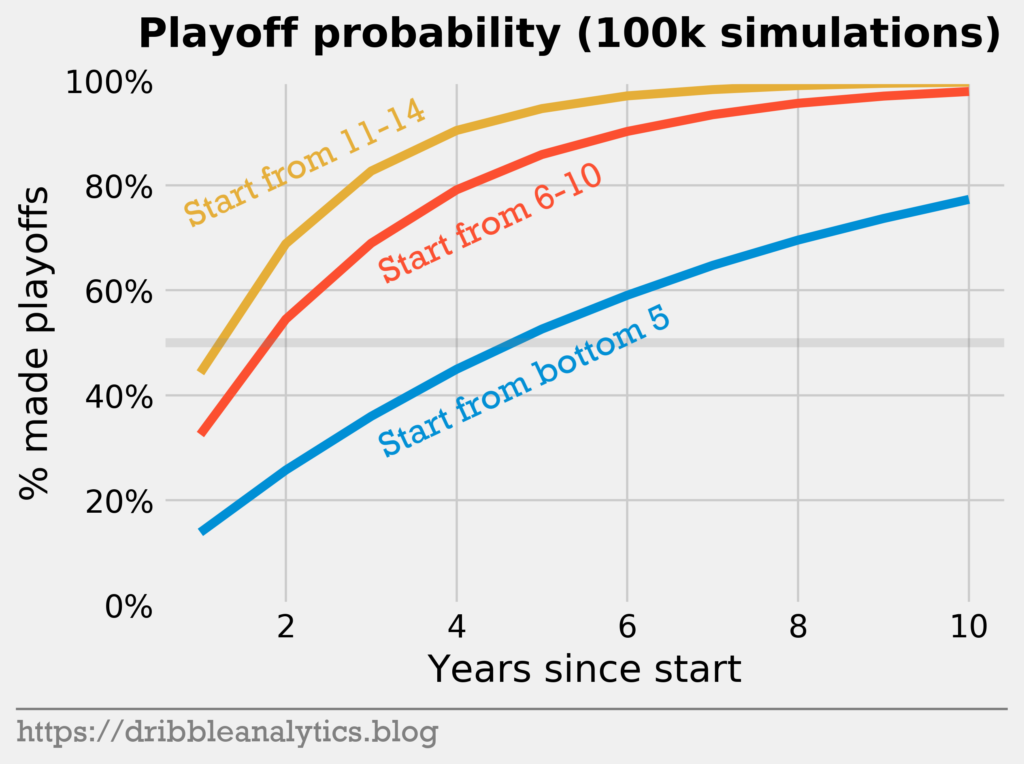
All the results so far show that a hard reset is much less viable than a moderate or soft rebuild. Realistically, very few top picks make a legitimate impact on a team’s success in their first few years, by which point the non-tanking teams have already improved too. Therefore, in terms of making the playoffs, tanking seems like a poor choice.
Though the playoffs are a high and realistic goal for bad teams, many view the goal of tanking as assembling a team that can compete deep in the playoffs. After all, the idea of tanking is earning a high draft pick so you have a higher chance at a superstar talent. To win late in the playoffs, you almost always need a superstar.
To solve this problem, let’s add even more states.
7-state Markov chain
If we split up “playoffs” into multiple states, we can examine the likelihood that a team wins a certain number of series. Our new seven states are:
- Bottom five
- Lottery
- Made playoffs
- Won 1 playoff series
- Won 2 playoff series (made conference finals)
- Won 3 playoff series (lost finals)
- Won 4 playoff series (won finals)
We no longer need to split up the lottery into 6-10 and 11-14 because we already saw that they perform significantly better than the bottom five teams. Therefore, we can assume that 6-10 will be somewhere between the bottom five line and the lottery line.
The table below shows the transition probability matrix for our new 7-state Markov chain.
| Bottom five | Lottery | Playoffs | 1 series won | Made conference finals | Lost finals | Won finals | |
|---|---|---|---|---|---|---|---|
| Bottom five | 0.48 | 0.38 | 0.09 | 0.04 | 0.01 | 0.00 | 0.01 |
| Lottery | 0.21 | 0.38 | 0.27 | 0.10 | 0.03 | 0.01 | 0.00 |
| Playoffs | 0.09 | 0.25 | 0.38 | 0.17 | 0.08 | 0.02 | 0.01 |
| 1 series won | 0.04 | 0.14 | 0.38 | 0.19 | 0.13 | 0.07 | 0.05 |
| Made conference finals | 0.00 | 0.09 | 0.35 | 0.23 | 0.17 | 0.09 | 0.08 |
| Lost finals | 0.00 | 0.06 | 0.18 | 0.30 | 0.18 | 0.12 | 0.15 |
| Won finals | 0.03 | 0.00 | 0.12 | 0.21 | 0.06 | 0.18 | 0.39 |
Examining a team’s probability to win the finals or make the finals produces a funky result. No teams won the finals one year after being a lottery team, but a team lost in the finals. Meanwhile, one team won a year after being a bottom five team (Celtics in 2007-2008), but no teams lost after being a bottom five team. Therefore, we’ll look at probability to reach the conference finals.
One argument that proponents of tanking make is that 7/8 seeds should try to get in the lottery because a small chance at a top pick is better than a tiny chance at winning a playoff round. This represents a type of “championship or bust” mentality. Because of this sentiment, we’ll include teams who made the playoffs but lost in the first round in this analysis.
First, let’s do 100,000 simulations to see the probability of making the conference finals in five years.
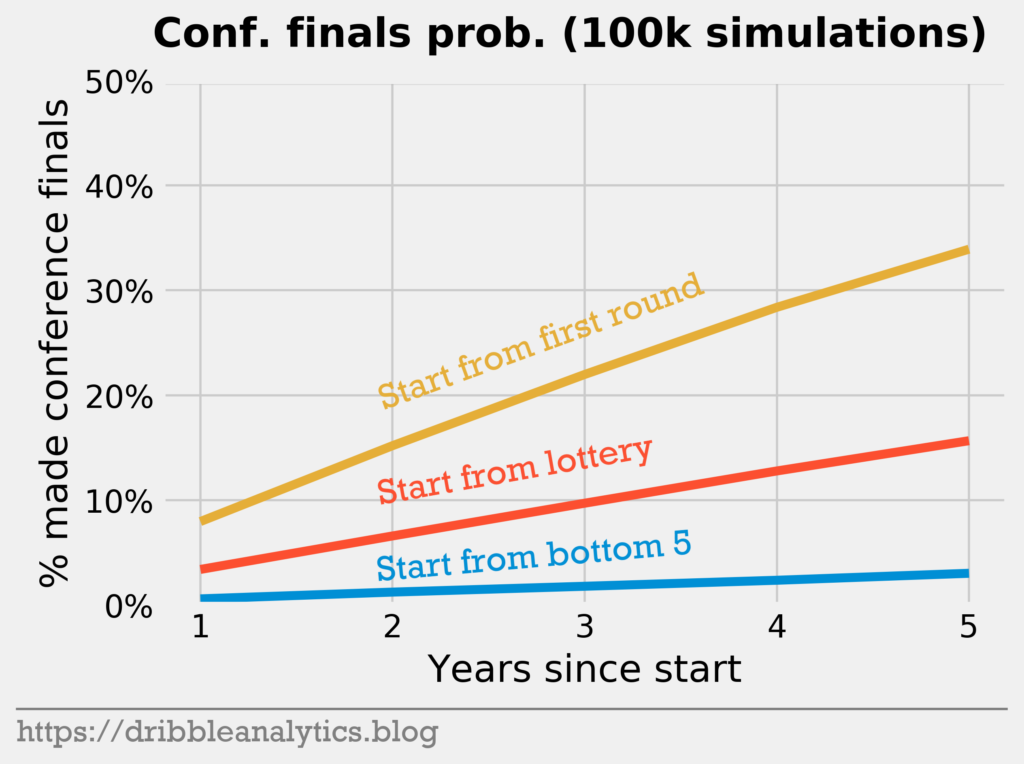
After five years, the team that starts with losing in the first round has a greater-than-30% chance to make the conference finals. Meanwhile, the bottom five team has a less-than-5% chance, and the lottery team’s chance is over 15%. Therefore, a team currently in the playoffs has an approximately 6x higher chance of making the conference of finals than a bottom five team within five years.
Let’s extend this simulation to ten years.
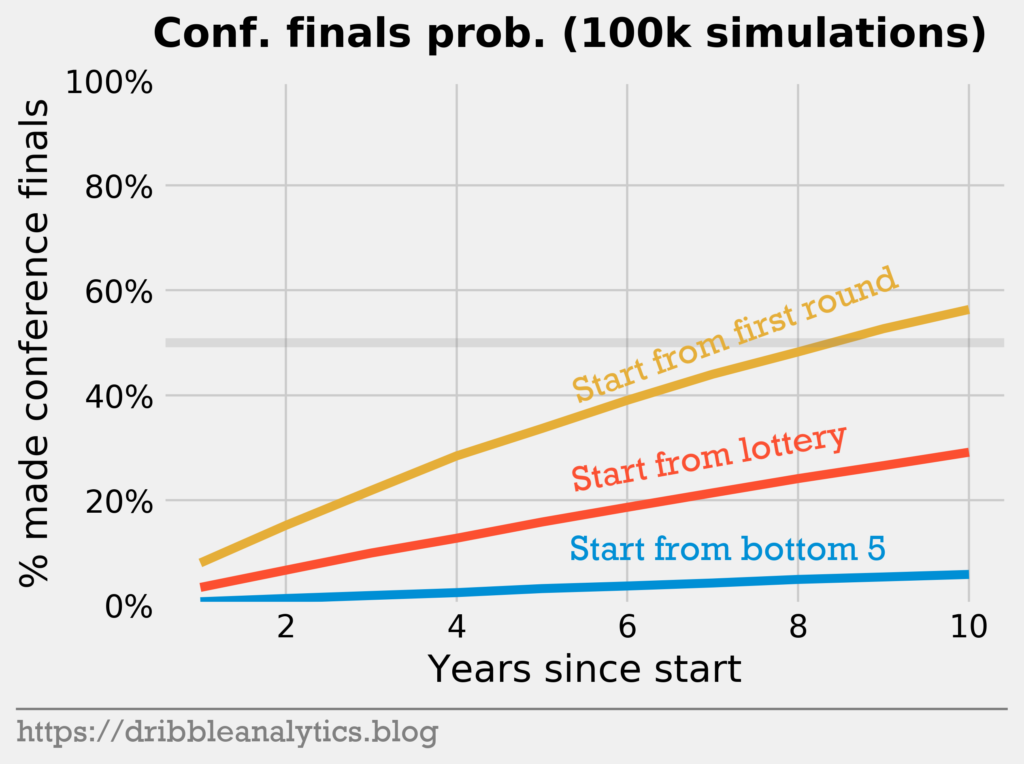
Within ten years, the team that made the playoffs is more likely than not to make the conference finals. Meanwhile, the team that starts in the bottom five has a tiny very small chance – less than 10%.
Conclusion
Though everyone hopes to be the 76ers when they tank, they’re much more likely to be the Suns. Teams in the bottom five have a much lower chance to make the playoffs or win the conference finals than teams in the rest of the lottery. This points to the fact that although player quality increases the earlier in the draft a team picks, lots of other factors affect the team.
Ultimately, it’s very random. Therefore, by modeling the transition with a Markov chain (a random process in itself), we can create an argument that tanking is not worth it.
This is pretty cool! I’m curious how things would change if you accounted for lottery results (actual spot in draft) as well? For instance the Nets over the past few seasons qualify as one of these “bottom 5” teams, but didn’t have any of the normal advantages of being one and still made it to the playoffs.
Thanks! I assume the results would change to show that tanking is more worth it than the analysis shows. The Nets are one example where a team had a few bottom 5 years but didn’t get the chance to improve. Because they didn’t have their pick, they weren’t necessarily “tanking” – they were just bad. This distinction creates a lot of the error in this analysis, and ultimately makes the analysis flawed. If there was a way to distinguish tanking from bad (such as benching players, horrible 4th quarter performances, etc.) and we could use that instead the results would look upon tanking more favorably.