Introduction
College defense differs from NBA defense significantly. Aside from NBA players being significantly more talented offensively than an average college player, college players play in vastly different defensive schemes. For example, many colleges use a zone for the whole game. This forces the defenders into unique roles that might not translate to the NBA.
For example, in a zone, a center roams the paint. Therefore, a college center can in theory go many games solely as a rim protector. This leads to the player having inflated defensive stats, as they will naturally get most of the team’s blocks if they are always in the paint. While rim protection is an important part of a big man’s defense, one-on-one defense is also important. However, in a zone, the center probably has very few opportunities to play one-on-one.
Because of the different nature of college and NBA defense, it is difficult to predict how a college player’s defense will translate to the NBA. Even for players who not only play on the top teams but also rarely play zone, projecting defense is a difficult task. This is seen through Karl-Anthony Towns’ defense in college compared to his defense in the NBA.
In college, Towns was a star defender. Many scouting reports cited his defense as a big positive. Towns had a stellar 10.8 DBPM and a block percentage of 11.5%. These factors coupled with the fact that Towns played for Kentucky – a team that rarely ran zone, and also had a high strength of schedule – made many think his defense would be a sure thing.
However, Towns now struggles on defense. His career average DBPM in the NBA is only 0.8, which is very low for a center.
Towns is one of many examples of players whose defense in college fails to translate to the NBA. Though defense can’t truly be measured by blocks, steals, or other metrics, we can try to use all of these metrics together to predict a player’s NBA defense. No defensive metric perfectly captures a player’s defensive ability. However, DBPM gives a general sense of a player’s defense. We will use several college statistics to try to predict the upcoming draft class’s DBPM, thereby showing which players in the draft class will be the best defenders.
Methods
First, I made a dataset of all college players selected in the first round since the 2011 draft. I recorded the following stats for them:
| College stats | NBA stats | Other information |
|---|---|---|
| Seasons in college | G | Wingspan (in) |
| G | MPG | Height (in) |
| MPG | STL/G | Position |
| STL/G | BLK/G | |
| BLK/G | DWS | |
| PF/G | DWS/48 | |
| STL% | DBPM | |
| BLK% | ||
| DWS | ||
| DWS/40 | ||
| DBPM |
I also restricted the players in the 2017 draft to those who played more than 10 games so that their DBPM is not completely unrealistic. 171 players met these restrictions.
Then, I recorded the above stats for the top 35 picks in The Ringer’s 2018 NBA Draft Guide (as of 6/13 update).
Using the current players dataset, I created 3 different machine learning models for guards, forwards, and centers:
- Linear regression
- Ridge regression
- Lasso regression
The model took most of the aforementioned college stats and other information as inputs, and output a player’s NBA DBPM. Though DBPM is not a perfect defensive stat, it gives us a good idea of whether a player is a good or bad defender.
I created each of the three models with varying test sizes. After the models for each position were created, I put in the 2018 draft class’s data to predict their DBPM. Players such as Marvin Bagley who The Ringer described as a “big” were put in both the centers’ model and the forwards’ model, as these players will likely play both forward and center.
Comparing college and NBA stats
On its own, college DBPM is not a bad predictor of NBA DBPM. The graph below shows the correlation between college and NBA DBPM for all the 171 players in our dataset.
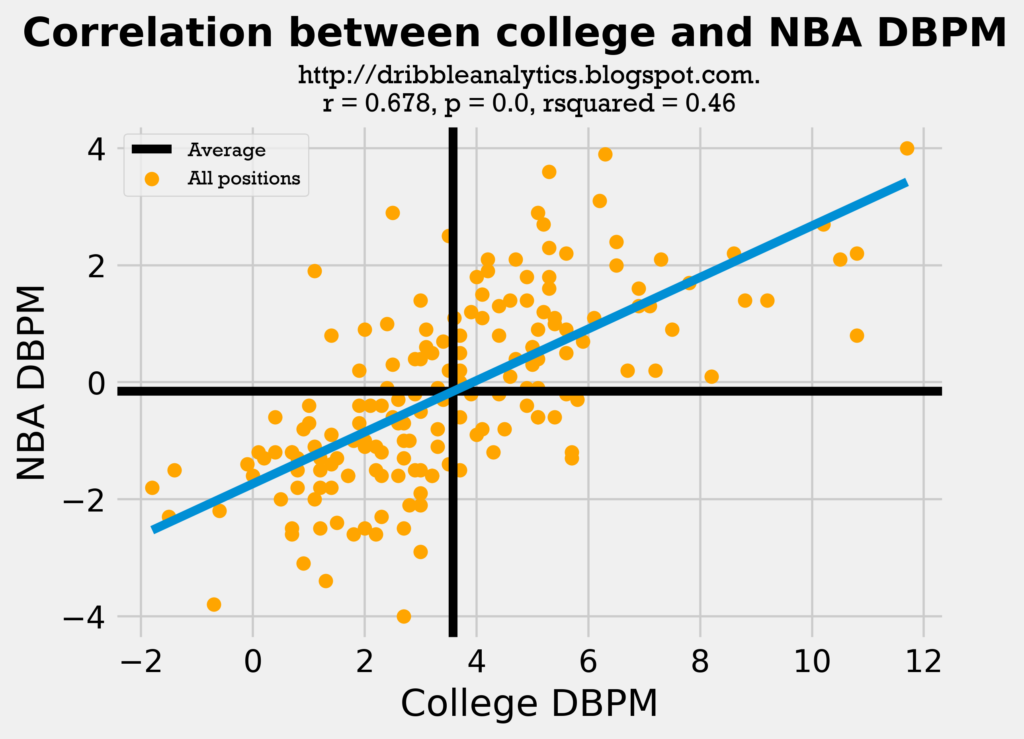
The regression is statistically significant, as its p-value is less than 0.05. The rsquared of 0.46 is not bad, and the correlation coefficient (r) of 0.678 shows that the correlation between college and NBA DBPM is not too weak.
The regression is also statistically significant when it is split up into guards, forwards, and centers:
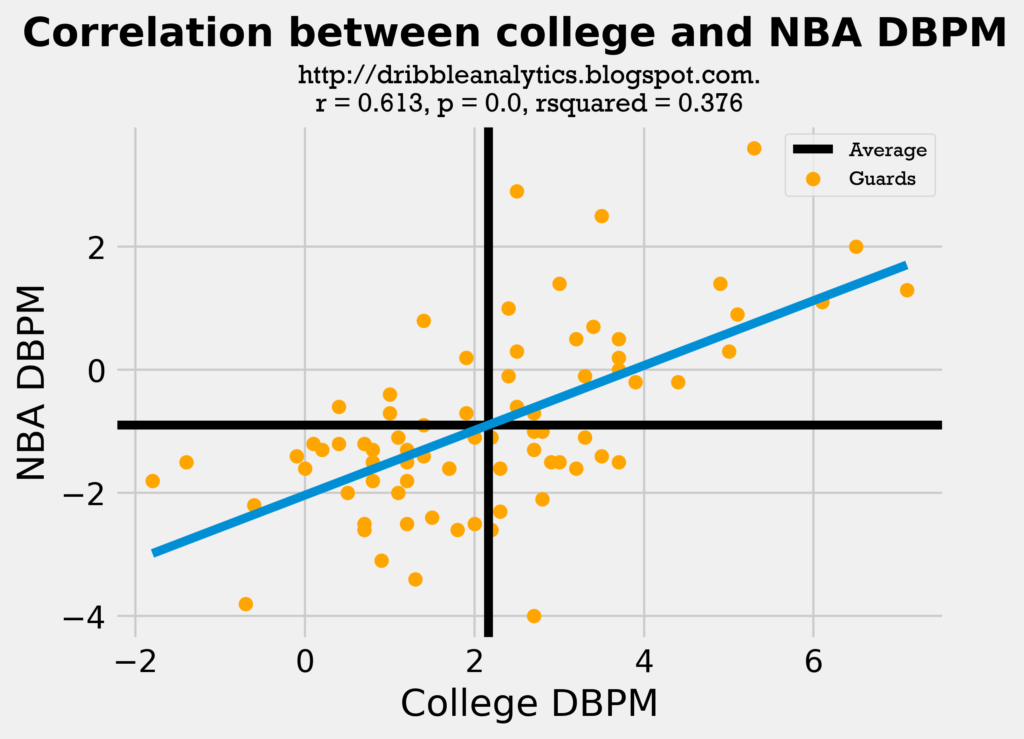
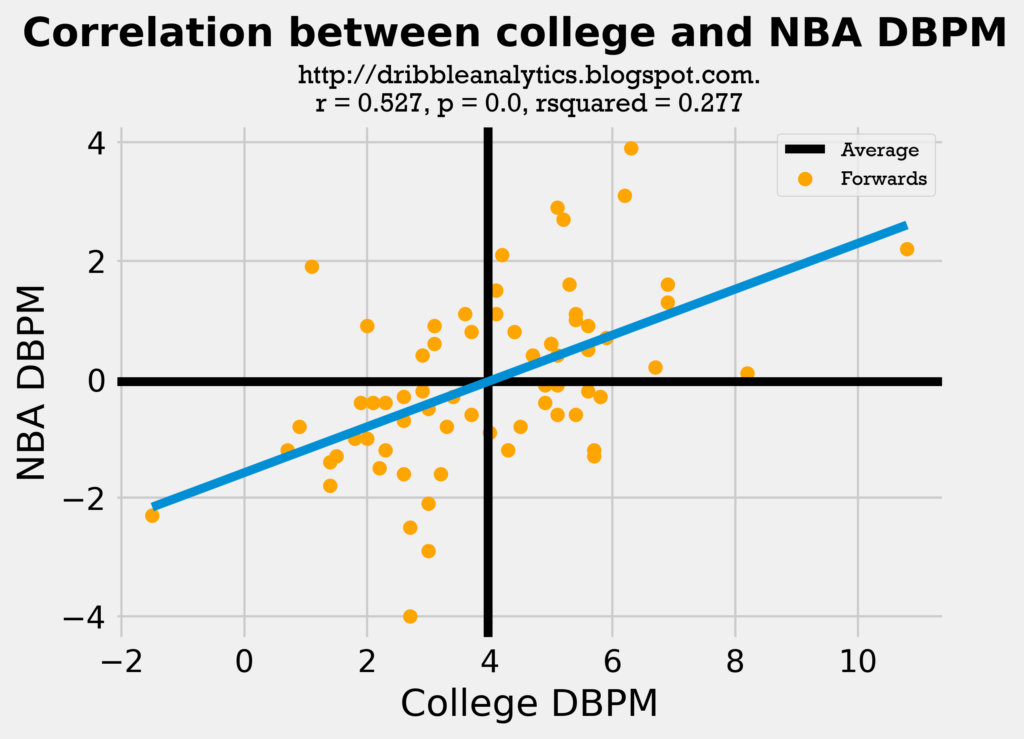
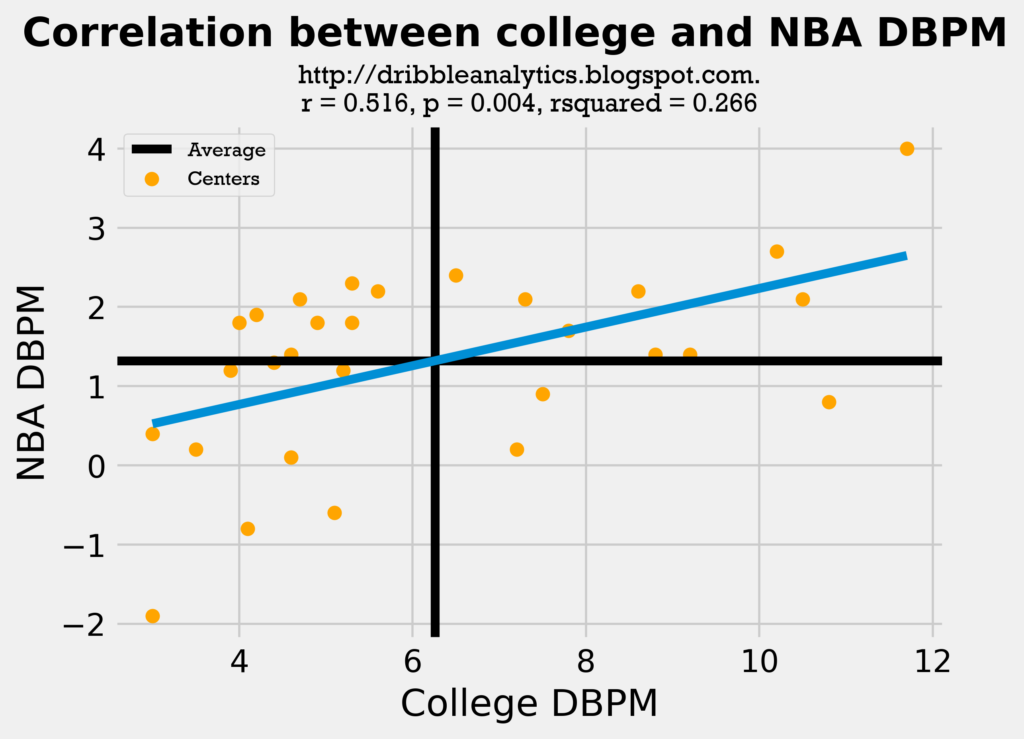
Although all these regressions have statistical significance, their correlation coefficient is not very high. Also, these only consider one factor (college DBPM) in predicting a player’s NBA DBPM; this regression would predict players who were solely rim protectors in limited minutes in college (and therefore had a high DBPM) as some of the best defenders in the league.
Therefore, to make the prediction more accurate, we must consider other factors as well. Before we add other stats such as steals and blocks into the model, we should test the similarity between blocks and steals for our current players dataset in college and our draft class dataset. If the distribution, mean, and standard deviation for the current players and draft class histograms seem close, then the comparison is fair.
First, let’s look at the steals histograms:
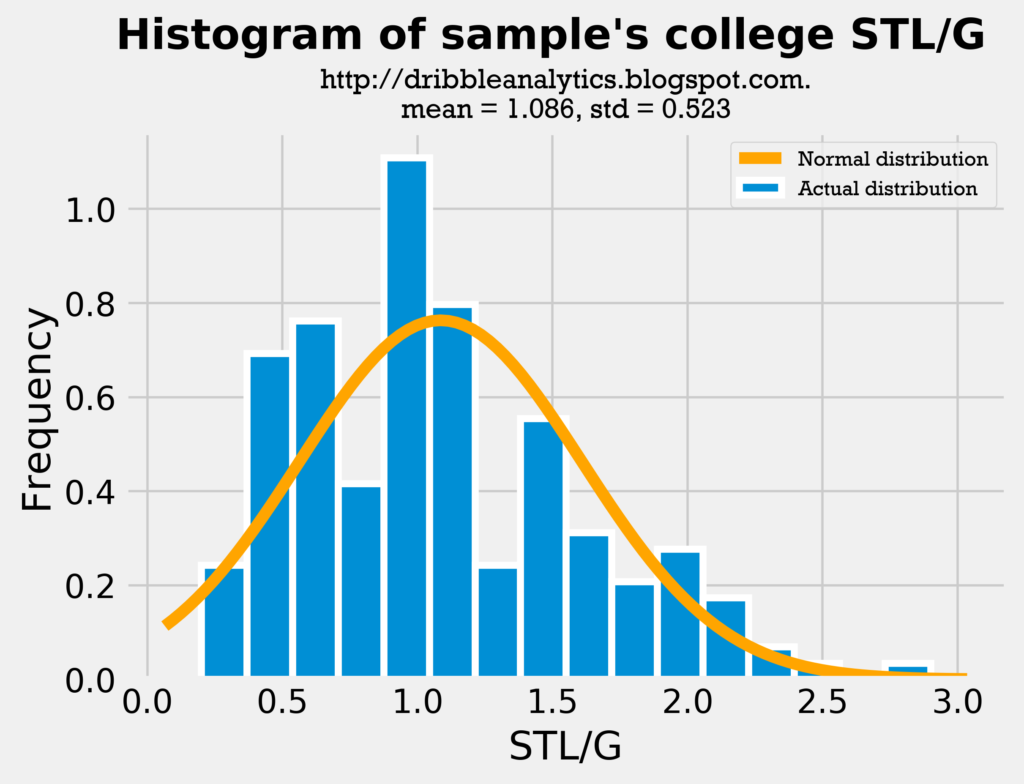
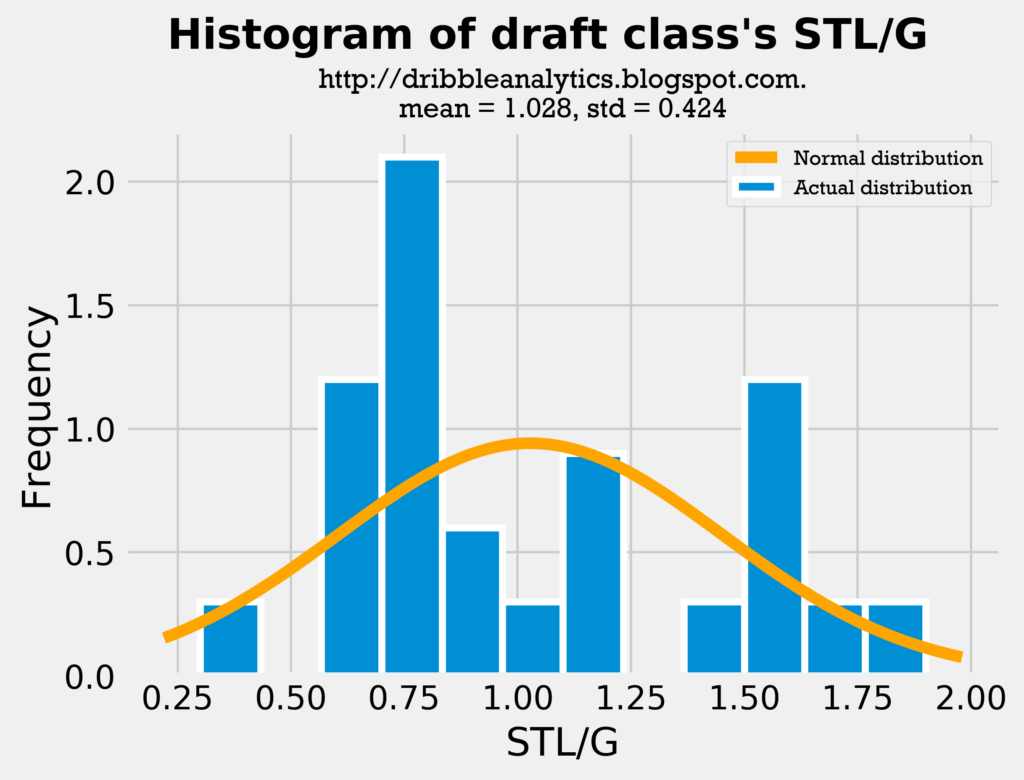
Though the draft class’s average steals is slightly lower than the sample’s average steals, they are close enough such that a comparison is fair. Furthermore, this draft class has a lot of big men (who don’t get many steals) compared to other classes, so it’s expected that the average steals is lower. The standard deviation of steals is lower for the draft class’s dataset, demonstrating that there is less variance in their steals.
Let’s look at the same thing for blocks:
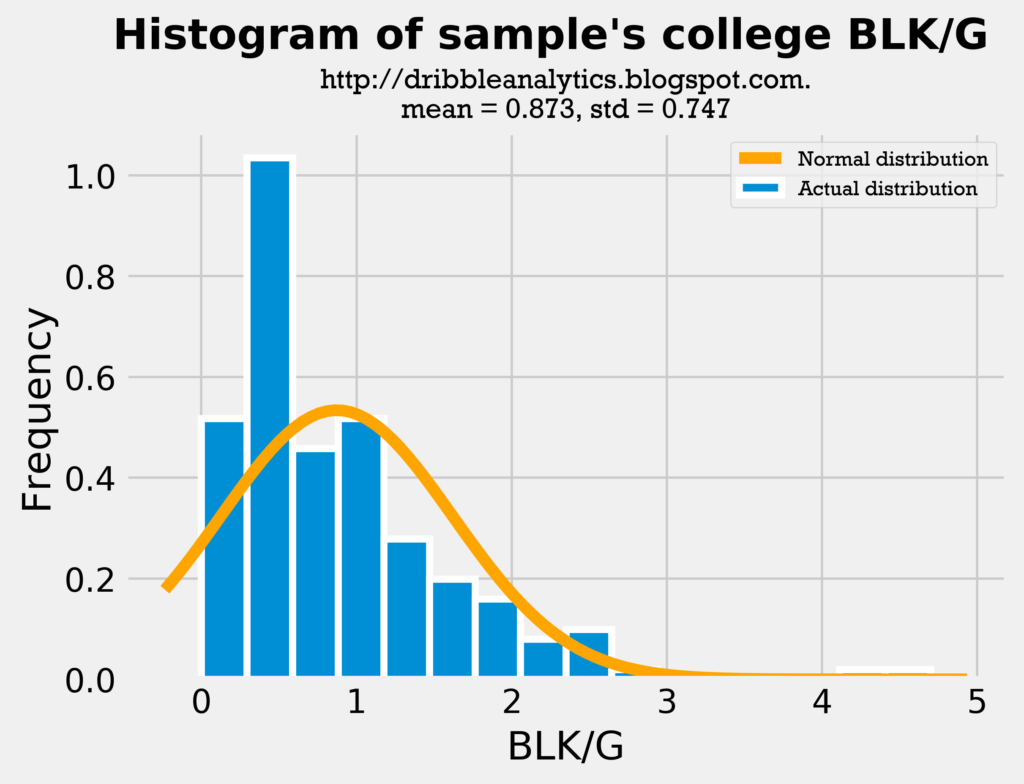
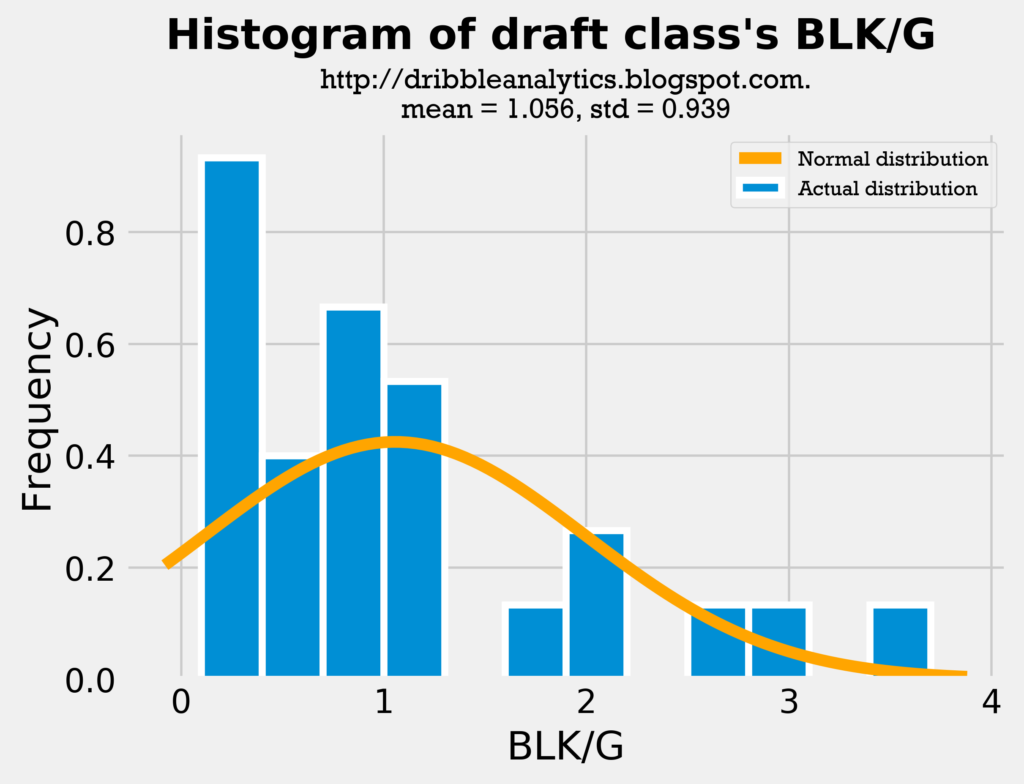
As expected, the draft class has a higher average of blocks, as there are more centers than usual. The higher average also lends to a higher standard deviation, as there will be more variance in blocks if the draft class is mostly centers and guards (because the difference in their blocks will be large). Nevertheless, the comparison is fair.
Model results: guards
For guards, 20% of the current players dataset was used as the test set, and 80% was used as the training set.
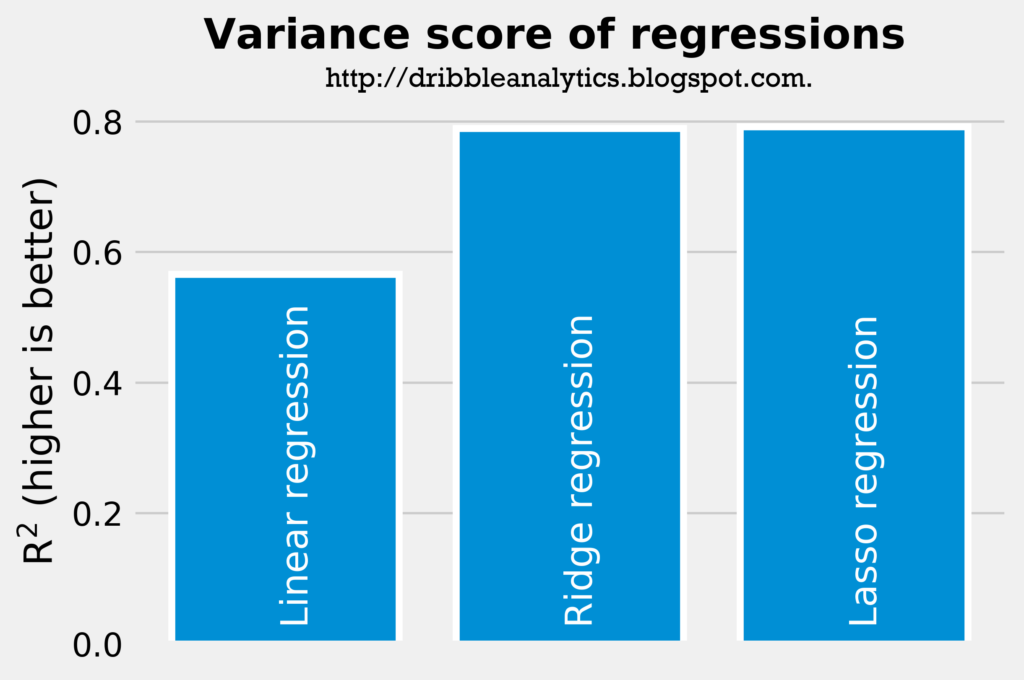
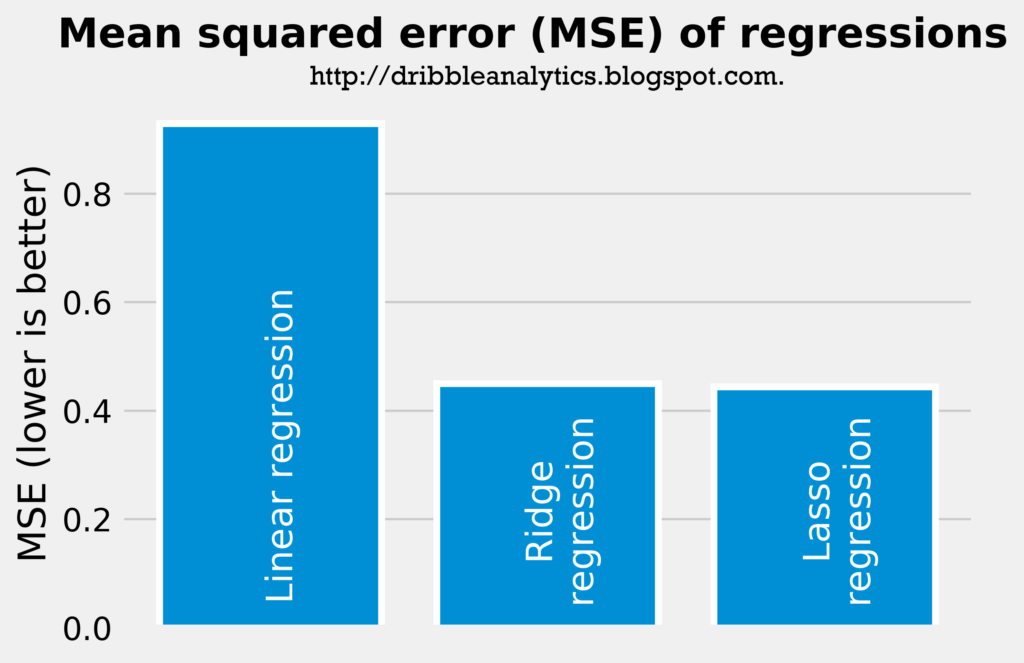
Regression accuracy
The two graphs below show the accuracy of the three regressions. The most accurate regression will have the highest r-squared and the lowest mean squared error.
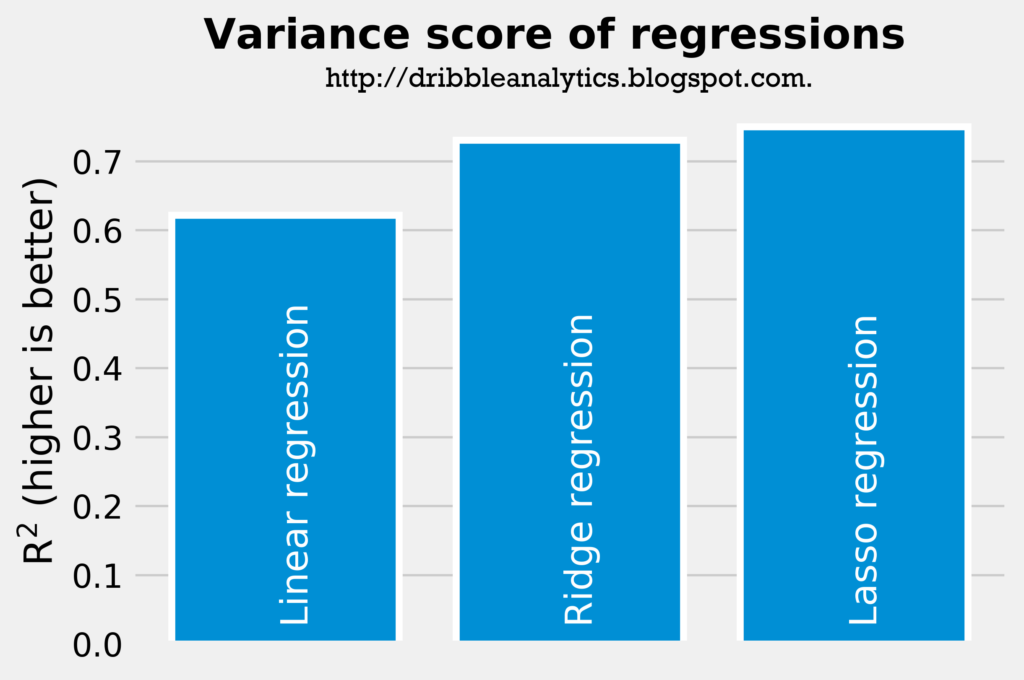
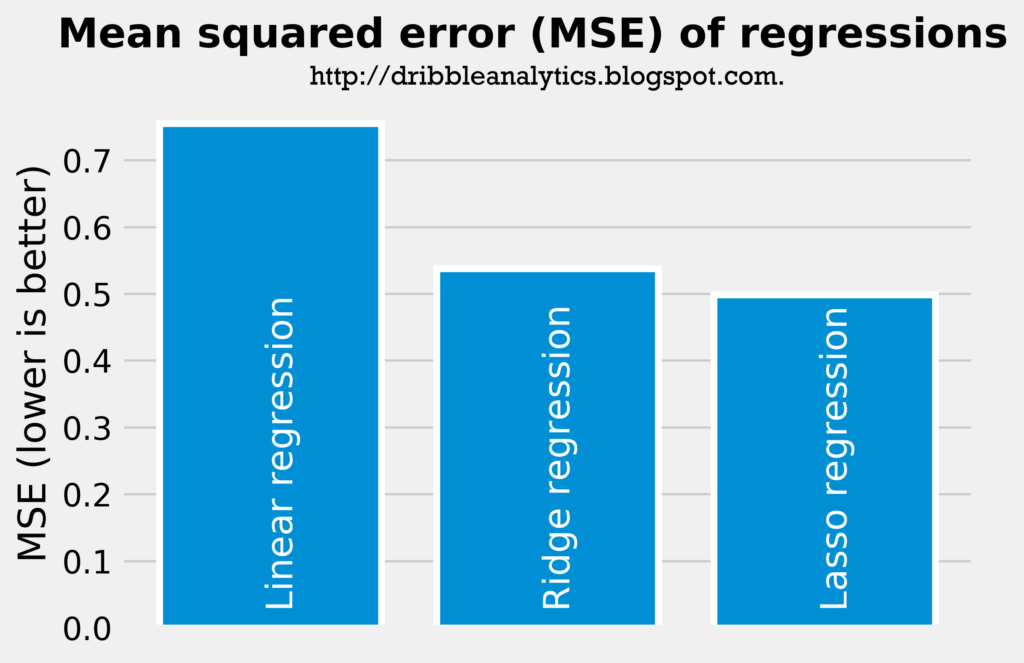
The rsquared and mean squared error shows that the linear regression is the least accurate regression, followed by the ridge regression. The lasso regression, then, is the most accurate regression.
This is further shown through the regressions’ cross-validation scores for explained variance. The linear regression’s cross-validation score was -1.06. The 95% confidence interval was +/- 3.84. So, the bad cross-validation score for the linear regressions shows that the regression is overfitting.
Meanwhile, the ridge and lasso regressions have more reasonable cross-validation scores. The ridge regression has the best cross-validation score at 0.78, with a 95% confidence interval of +/- 0.20. The lasso regression – the most accurate regression according to rsquared and mean squared error – had a worse cross-validation score; its score was 0.72, with a 95% confidence interval of +/- 0.33.
Therefore, the linear regression is the least accurate when we consider cross-validation scores. However, the better cross-validation score for the ridge regression shows that the ridge regression might be more accurate than the lasso regression. For the purpose of this analysis, we’ll say that the ridge and lasso regressions are both equally accurate.
Regression results
The following three graphs show the predicted DBPM for the draft class’s guards by the linear regression, ridge regression, and lasso regression, respectively.
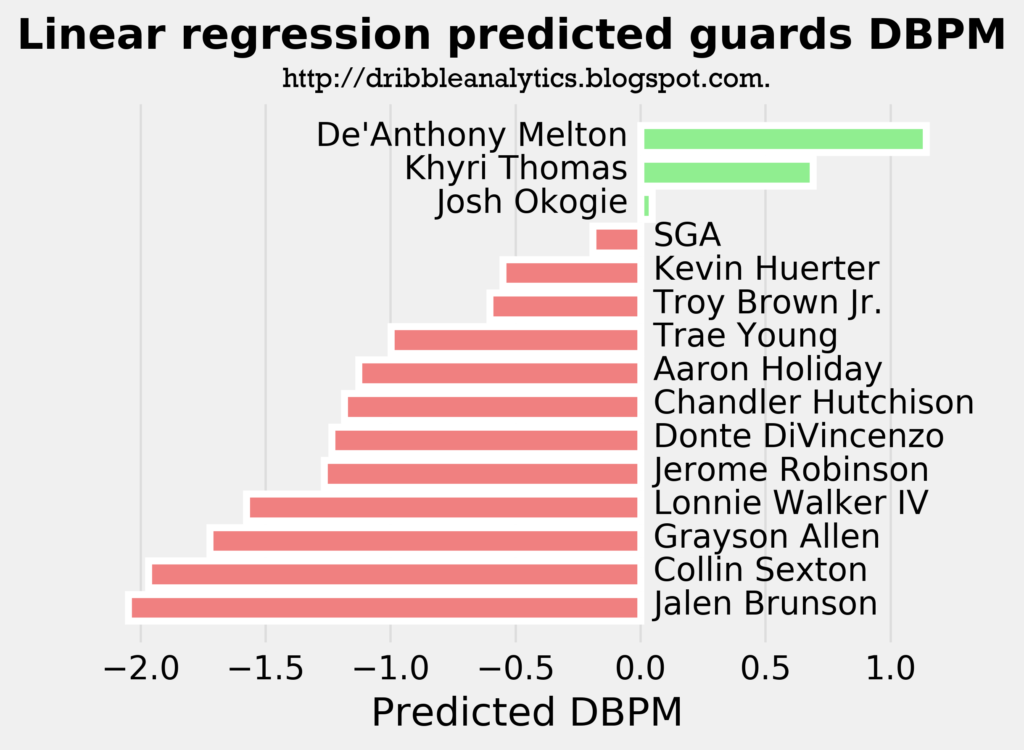
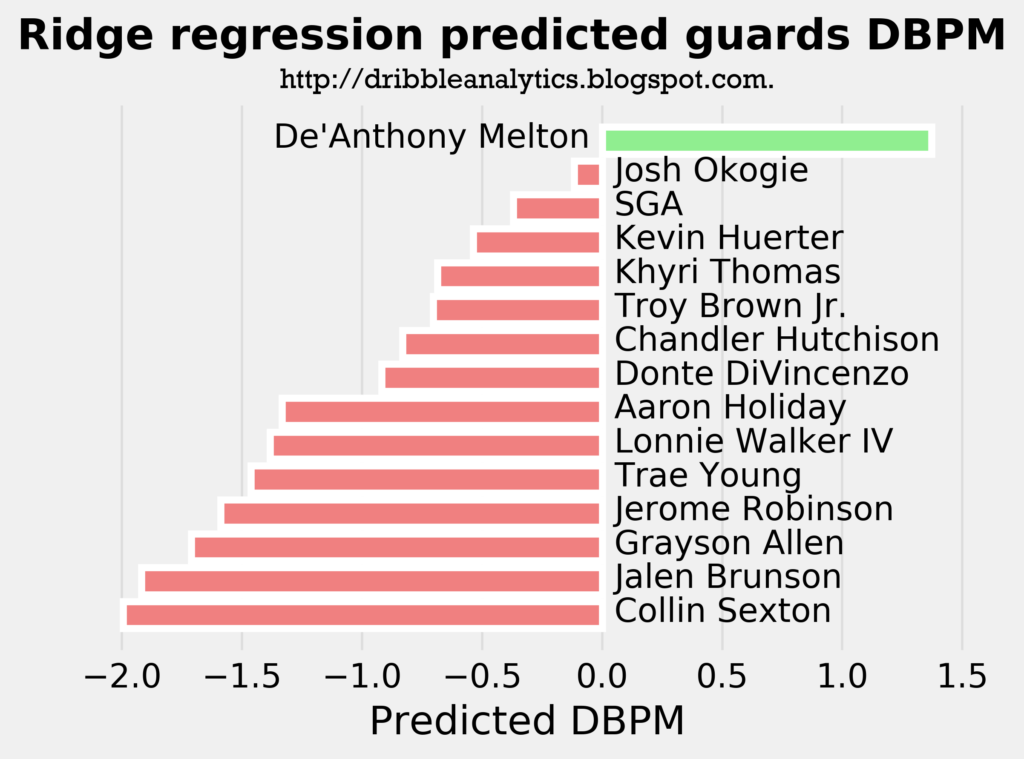
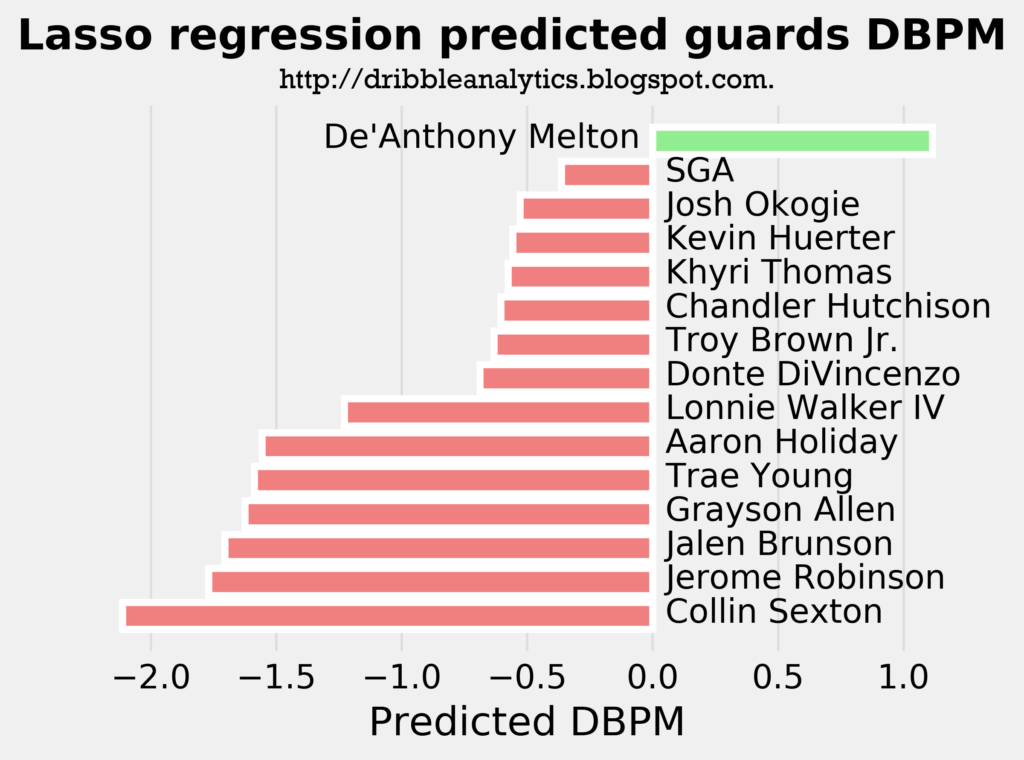
The linear regression, which we determined was the least accurate of the three, showed that De’Anthony Melton, Khyri Thomas, and Josh Okogie will be the only positive defenders from the guards of this draft class. The other two regressions – which were more accurate than the linear regression – found that De’Anthony Melton will be the only guard with a positive defensive impact. All three models predict a DBPM for Melton of over 1, which is phenomenal for a guard. For comparison, Marcus Smart has a career DBPM of 1.1.
The graph below averages the predicted DBPM from all three models.
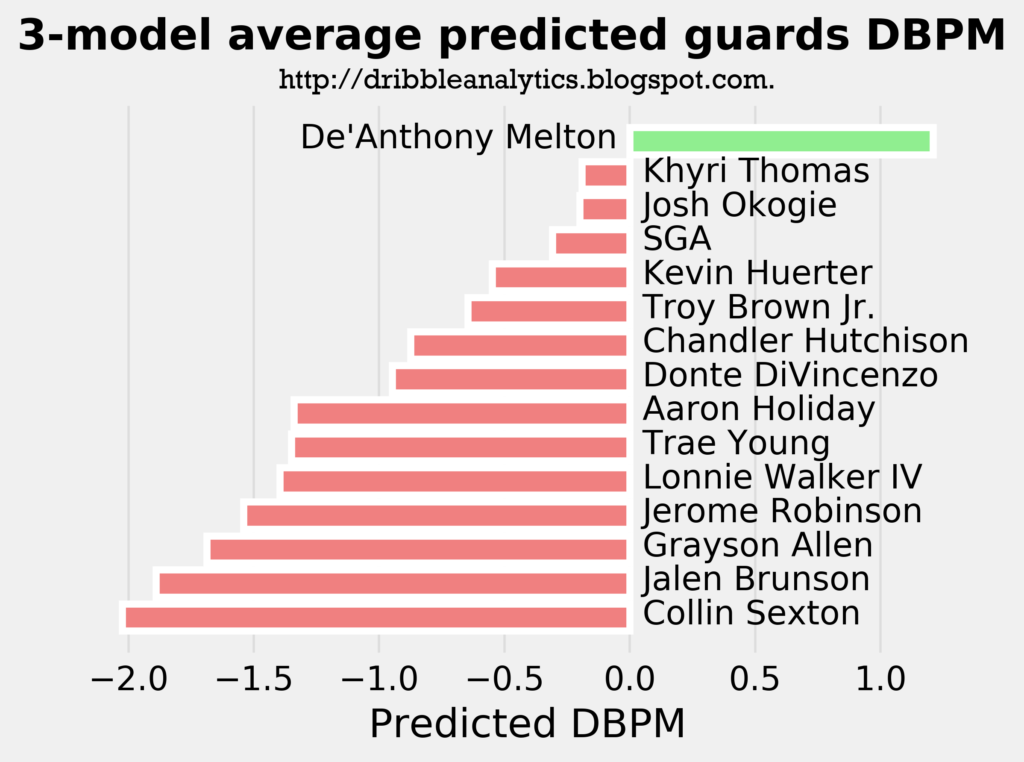
On average between the three regressions, De’Anthony Melton is the only guard who the models project to be a positive defender. Collin Sexton’s predicted DBPM of less than -2.0 puts him at a level of defense worse than Damian Lillard (whose career DBPM is -1.5), yet not as bad as Isaiah Thomas (whose career DBPM is -2.8).
Model results: forwards
Initially, I expected to do make the model using all forwards. However, the forwards model had a very low rsquared (all three models had an rsquared below 0.375) and a negative cross-validation score. So, I split it up into small forwards and power forwards.
It ended up that the power forwards regression was even worse than the forwards regression; all three models had a negative rsquared, which means the models were less accurate than us saying “every single forward will have the same DBPM of x.”
Because the small forwards model was much more accurate than the model for all forwards, we put the players into the small forwards model. The small forwards model’s test set was 25% of the dataset.
Regression accuracy
The two graphs below show the accuracy of the three regressions.
The linear regression was the least accurate model. The ridge and lasso regressions had almost exactly the same rsquared (0.790 for the ridge regression vs. 0.792 for the lasso regression), so they were similarly more accurate than the linear model.
This accuracy is further seen through the cross-validation score. The linear regression had the lowest cross-validation score (0.27 with a 95% confidence interval of +/- 1.28). The lasso regression’s cross-validation score was 0.46 with a 95% confidence interval of +/- 0.88. The ridge regression had the highest cross-validation score (0.62 with a 95% confidence interval of +/- 0.69).
The cross-validation scores help us come to the conclusion that the ridge regression is the most accurate model, followed by the lasso regression, and then the linear regression.
Regression results
It’s important to remember that we are putting in the draft class’s forwards (which includes players like Jaren Jackson Jr. and Marvin Bagley, who are a PF/C) into a model built of small forwards. Though this might seem odd, as some of these players will never play small forward, I think of it in a way that the model essentially outputs the big man’s ability as a perimeter defender. For example, if Jaren Jackson Jr. guarded the same types of players as a SF, his DBPM would be x.
The three graphs below show the projected DBPM for the draft class’s forwards using our SF model with a linear regression, ridge regression, and lasso regression, respectively.
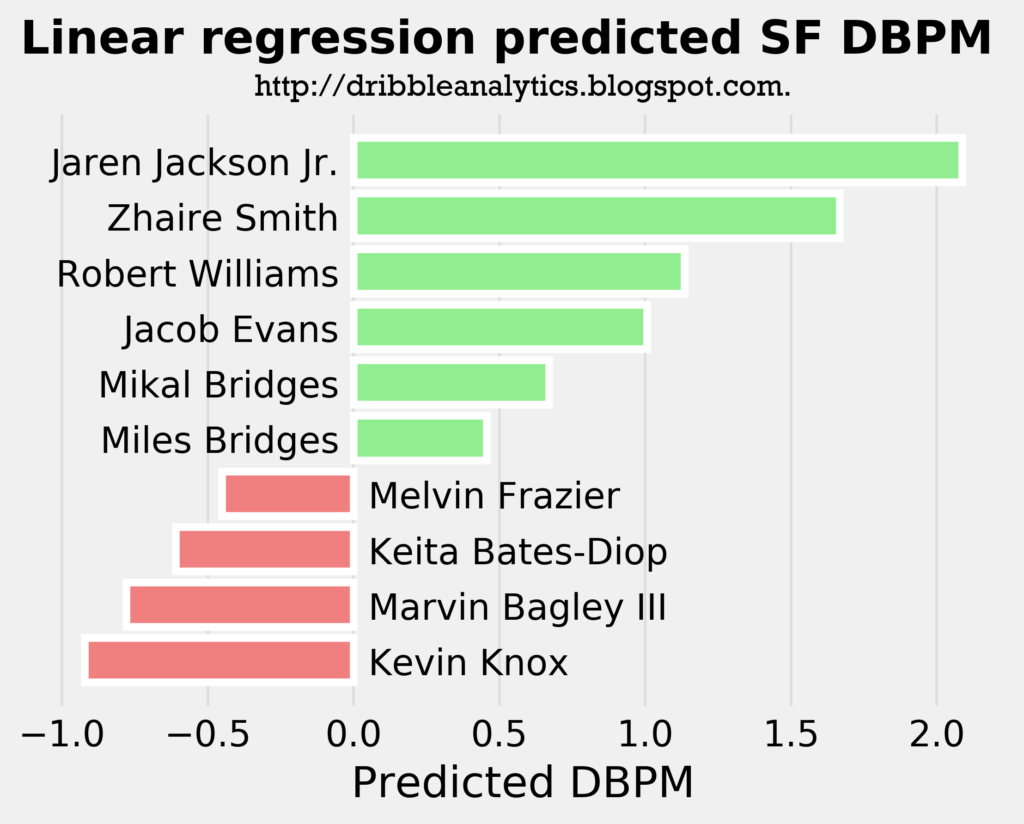
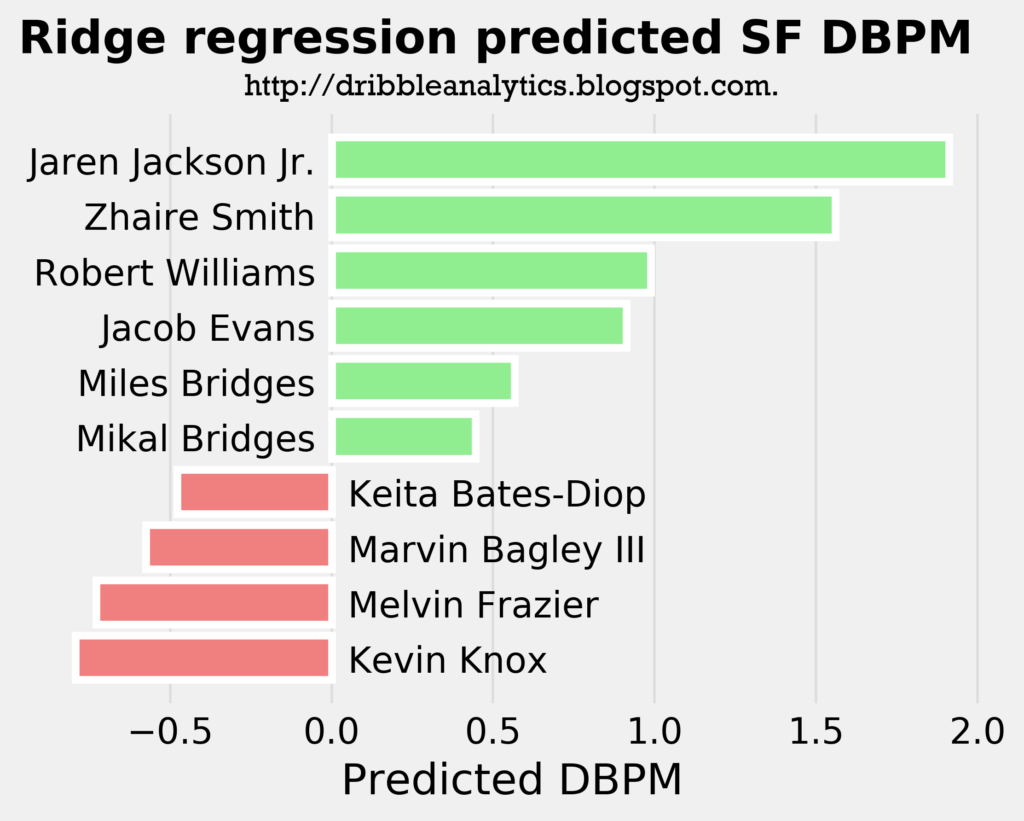
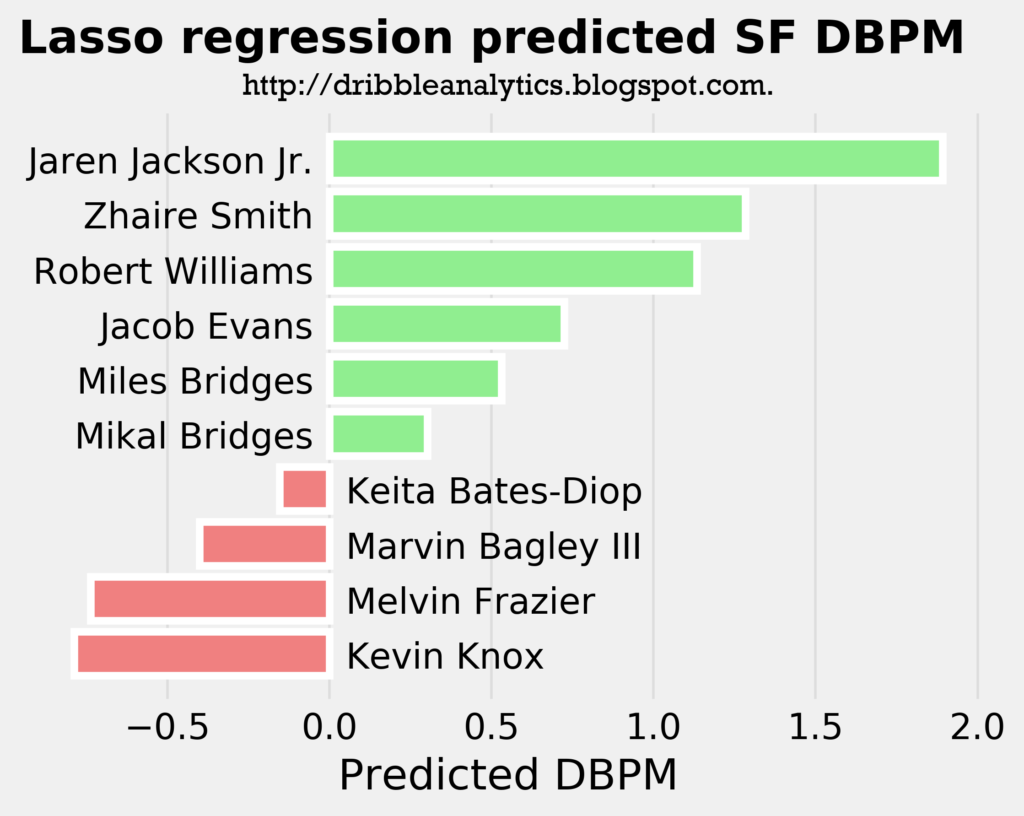
Interestingly, Jaren Jackson Jr. is the best defender in all three models, even though he is a big man. This shows how great his defense is; the models project him to be a better perimeter defender as a big man than other actual perimeter players like Miles Bridges.
Though Kevin Knox is projected as the worst defender in all three models, his projected DBPM is not on the same level as the worst forward defenders in the league. For example, while Knox’s predicted DBPM is less than -0.5, Melo and Andrew Wiggins have career DBPMs of -1.2 and -2.1, respectively.
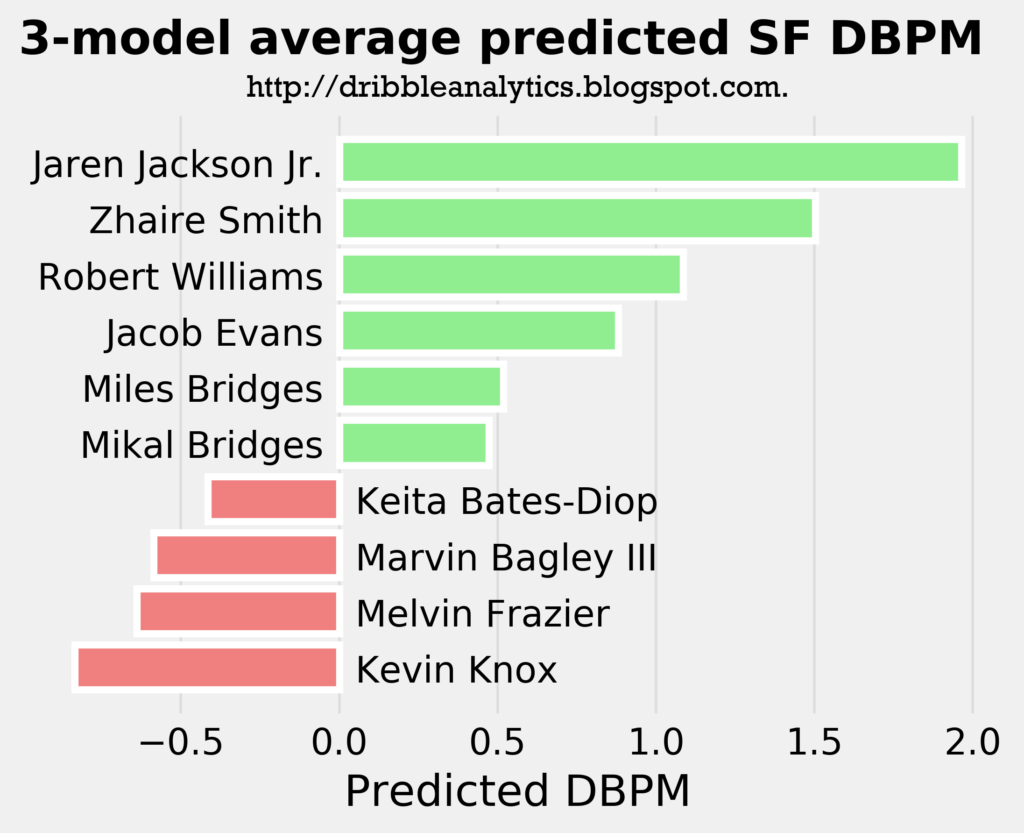
The graph below shows the average predicted DBPM for forwards.
Model results: centers
For centers, 10% of the current players dataset was used as the test set. Though in most cases this is too low and would lead to overfitting, only 30 players were in the centers dataset, so using 20% or more of the dataset would lead to inaccurate results. Furthermore, the overfitting problem can be examined using cross-validation.
Regression accuracy
The two graphs below show the accuracy of the three regressions.
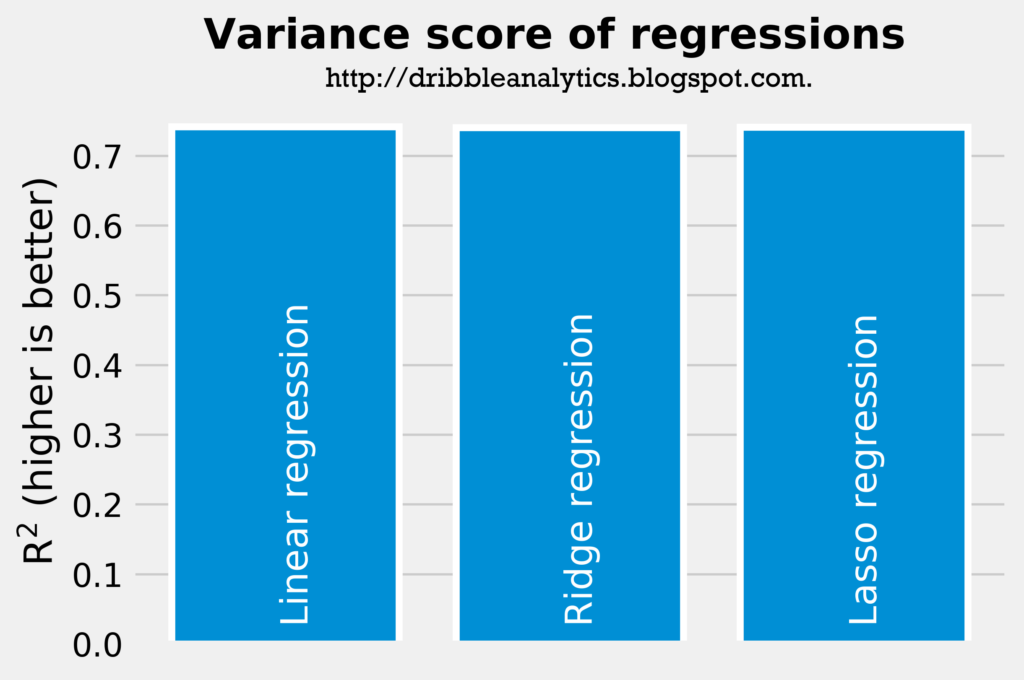
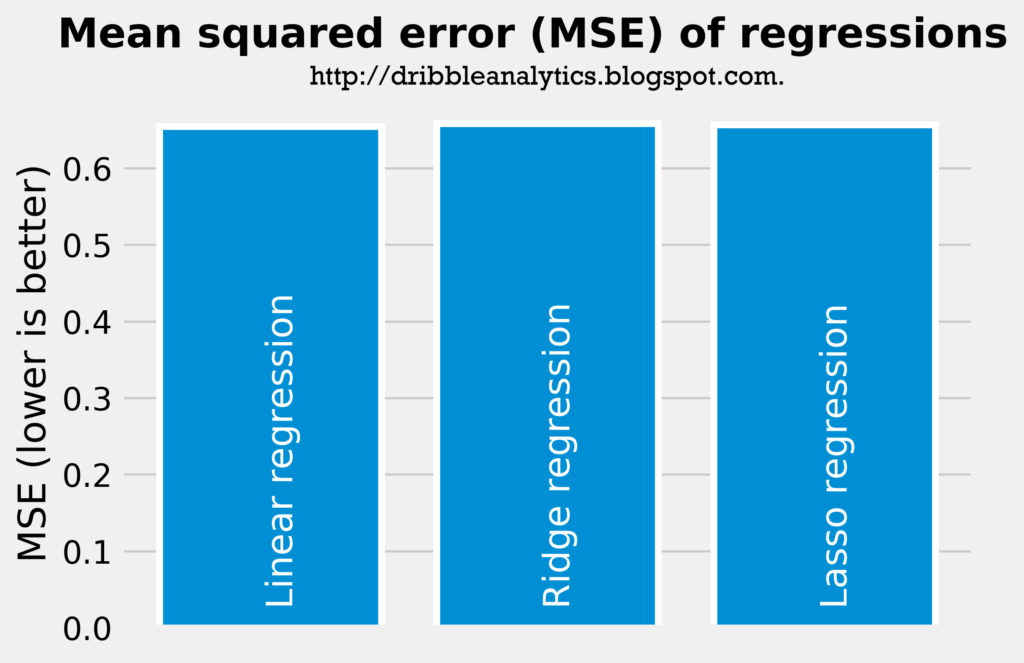
All three regressions had almost identical rsquareds; the linear regression had an rsquared of 0.742, while the ridge and lasso regressions both had an rsquared of 0.741. All three models also had very similar mean squared errors; though the linear regression had the lowest mean squared error, it was only 0.004 less than the ridge regression, which had the highest mean squared error.
Without considering cross-validation, all three models are similarly accurate. The linear regression has a cross-validation score of 0.55 with a 95% confidence interval of +/- 0.90. The ridge regression has the exact same score and confidence interval as the linear regression. Meanwhile, the lasso regression’s score is slightly better at 0.60, with a 95% confidence interval of +/- 0.79. Therefore, we can say the lasso regression is slightly more accurate than the linear and ridge regressions, though all three are pretty close in terms.
Regression results
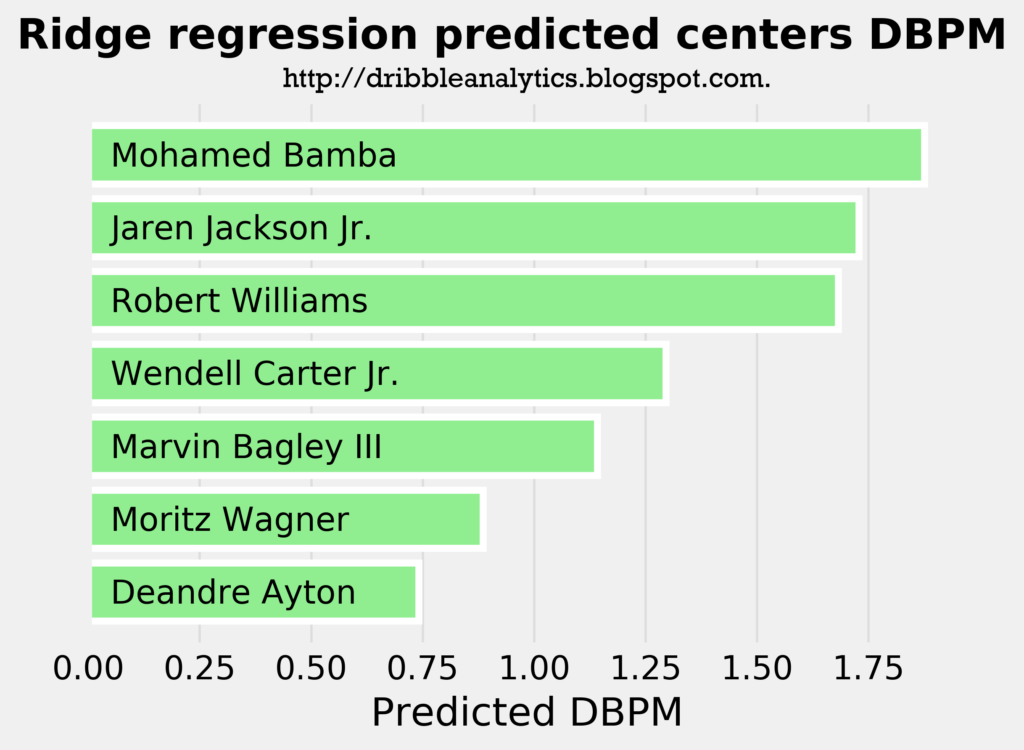
The three graphs below show the predicted DBPM for the draft class’s centers using a linear regression, ridge regression, and lasso regression, respectively.
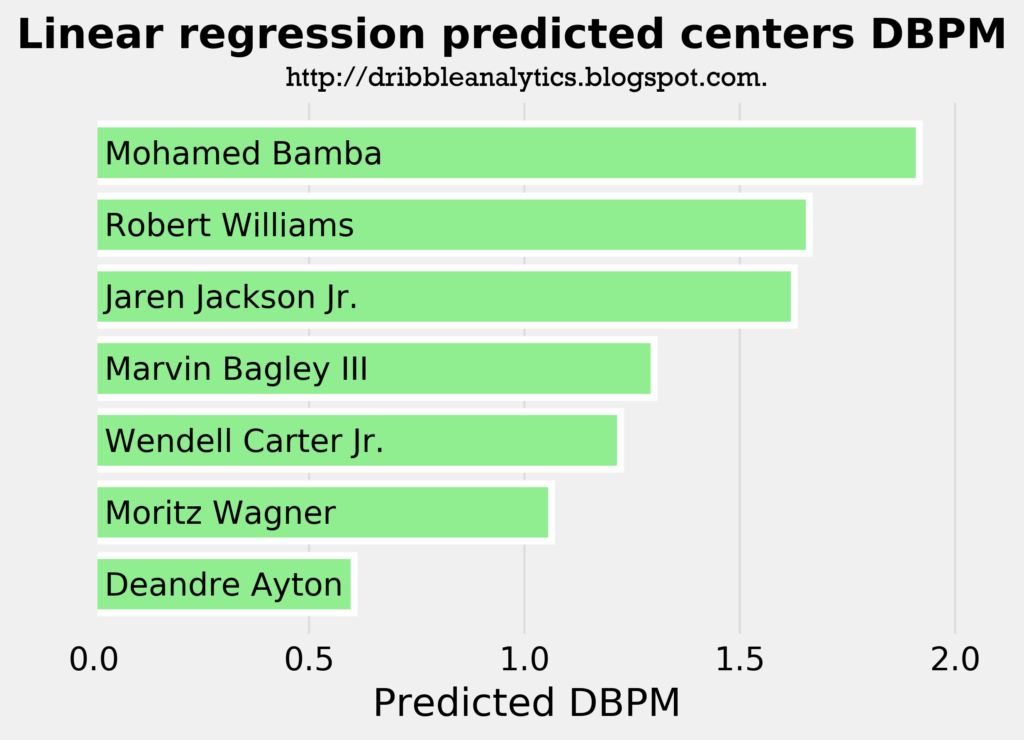

All three models project that none of the centers will be net negative defenders. However, DBPM greatly favors centers; even Jahlil Okafor, one of the worst defensive centers in the NBA, has a career DBPM of only -0.8. Karl-Anthony Towns, who gives little effort on defense and is also criticized as an underwhelming defender given his physical tools, has a career DBPM of 0.8.
Therefore, even though all three models predict Deandre Ayton will be a positive defender, the models predict he will be a worse defender than Towns.
All three models confirm the view that Mo Bamba is the best defensive prospect in this class. Surprisingly, Robert Williams has a very similar predicted DBPM to Jaren Jackson Jr., the prospect who many view as the best defender in the draft after Bamba.
The graph below shows the average of the predicted DBPM from the three models.
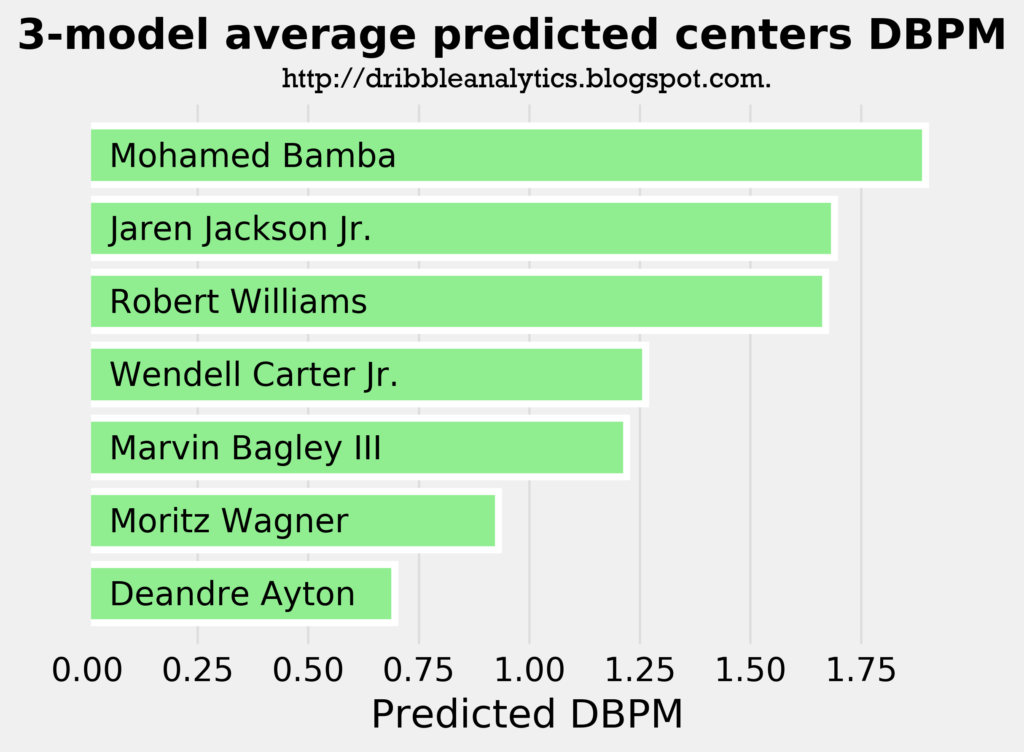
Conclusion
The models predict the De’Anthony Melton will be the best guard defender by a large margin, and Collin Sexton will be the worst by a decent margin.
Out of the true small forwards, the models predict that Zhaire Smith will be the best defender. However, Jaren Jackson Jr. has a higher predicted DBPM than him in the same model, demonstrating Jackson’s huge potential as a perimeter defender.
Though it predicts Deandre Ayton will be a positive defender, the model says Ayton will be a worse defender than Towns. Meanwhile, the model predicts Bamba will be the best big man defender in the draft.
Work for Tesla so we can have self-driving cars 😛
JK. Great job.
Well done my man!
I would recommend using RAPM as a dependent variable in any follow-up studies as RAPM is a measured value / estimate of player production on court whereas BPM is a RAPM prediction model.