This post is lighter on hard stats than my others, and has no machine learning like my other posts. I’ll hopefully put out another ML post soon. Note that none of the salary adjustments are an estimate of how much the players would make without max contracts; they’re just visualizations of how much players would earn without max contracts when paid at the same rate as the rest of the NBA.
Introduction
In the 2017 CBA, maximum contracts for veterans were raised from 30% of the cap to 35%. This means that a player who signed this past offseason would get 35% of the $101.869 million salary cap, or $35.65 million in the 2018-19 season. This is what LeBron James, Chris Paul, and Russell Westbrook are all earning this year.
Though a $35.65 million maximum contract appears massive, many superstars remain underpaid. LeBron is worth more than Chris Paul, yet he earns the same because of the price ceiling on contracts. Furthermore, LeBron is clearly worth more than 35% of a team’s cap, as seen by how bad the Cavs have been following his departure. It’s not crazy to say LeBron should be earning more than 50% of the cap given his immense contributions.
Let’s look at a few different metrics to see how much the NBA’s top 10 players (according to ESPN) would be paid if there were no max contracts and they were paid at the same rate per stat as the rest of the NBA.
Methods
Using Basketball Reference’s player contract data, I collected every player’s 2018-19 salary, and matched it to their 2017-18 stats.
All players currently on first-round rookie contracts were removed. These contracts have neither a price floor nor a price ceiling; the player’s draft position determines the contract. Therefore, comparing a player’s stats to their salary is unfair, as their performance doesn’t affect their salary. Furthermore, rookie contracts are some of the best bargains in the league (like Ben Simmons earning $6.434 million this year).
Two additional minor changes were made. Gordon Hayward and Kawhi Leonard both suffered major injuries last year. So, their 2017-18 stats don’t reflect their 2018-19 contract. For Hayward and Leonard, I used 2016-17 stats (and still used the 2018-19 contract).
Though I was debating removing players on the vet minimum or MLE, I decided against it. The problem we’re approaching here is removing a price ceiling, so a price floor (which a minimum and MLE establishes) shouldn’t be a problem.
I separated the top 10 players from the rest of the players, excluding rookie contracts players. From now on, “the database” and “non-star” refer to the dataset of all NBA players not on a rookie contract and not on the ESPN top 10 players list.
Players currently on max contracts were not removed from the database; for example, Chris Paul is still there.
To estimate the top 10 players’ salaries if there were no max contracts, I went through this basic process multiple times:
- Find the sum of the 2018-19 salaries in the database, excluding the top 10 players.
- Find the sum of a specific 2017-18 stat in the database, such as VORP or BPM.
- Divide the sum of the salaries by the sum of the stat. This gives us a salary per stat, which we can then apply to the superstars.
- Multiply the superstars’ stats by the salary per stat constant to find the stat-adjusted salary.
For WS and PPG, where most players will be positive, I used three methods to adjust the salary to the stat:
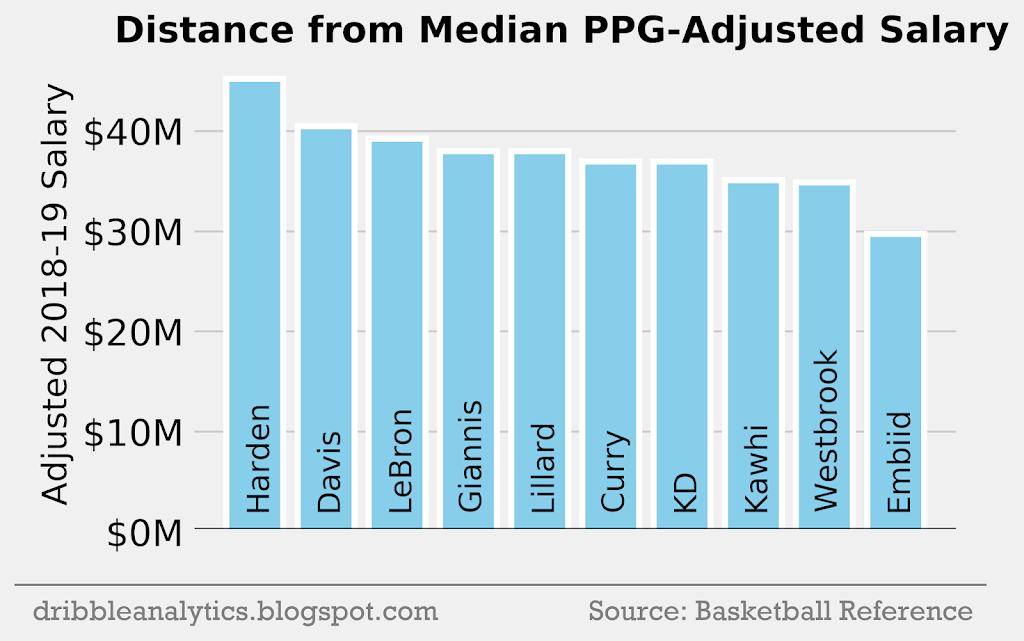
- Calculate the median WS and PPG of the non-star database and subtract each value from the median, then take the absolute value of all negative values. This gives a “distance” from the median stat. (This will produce the lowest result of the 3 methods).
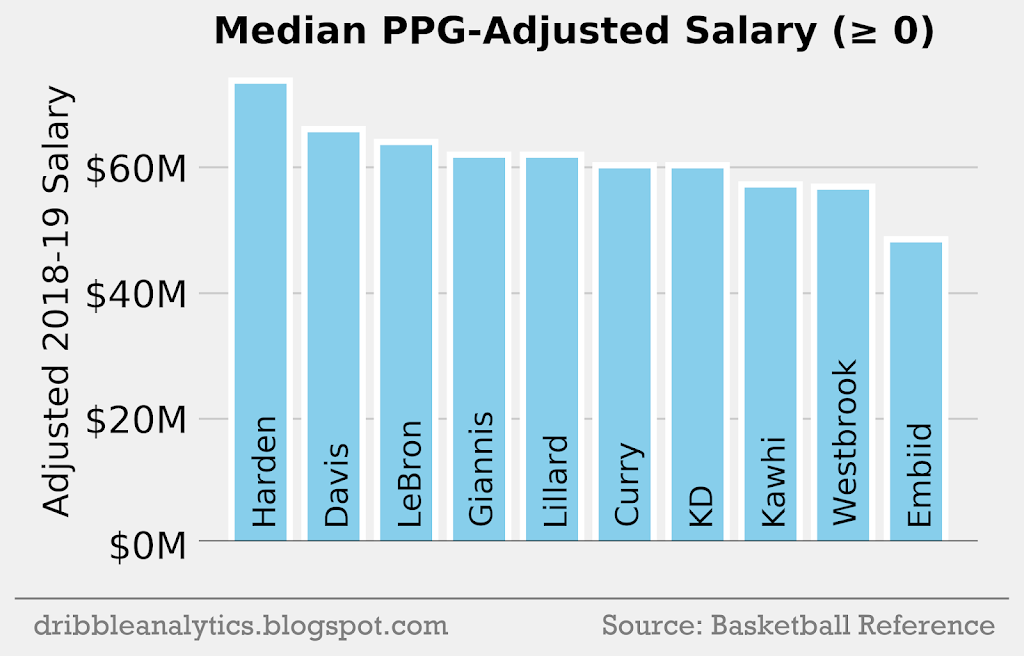
- Instead of making negative values positive (as in method 1), all negative values are set to 0. This means that players below the median WS and PPG will have no effect on the additional salary.
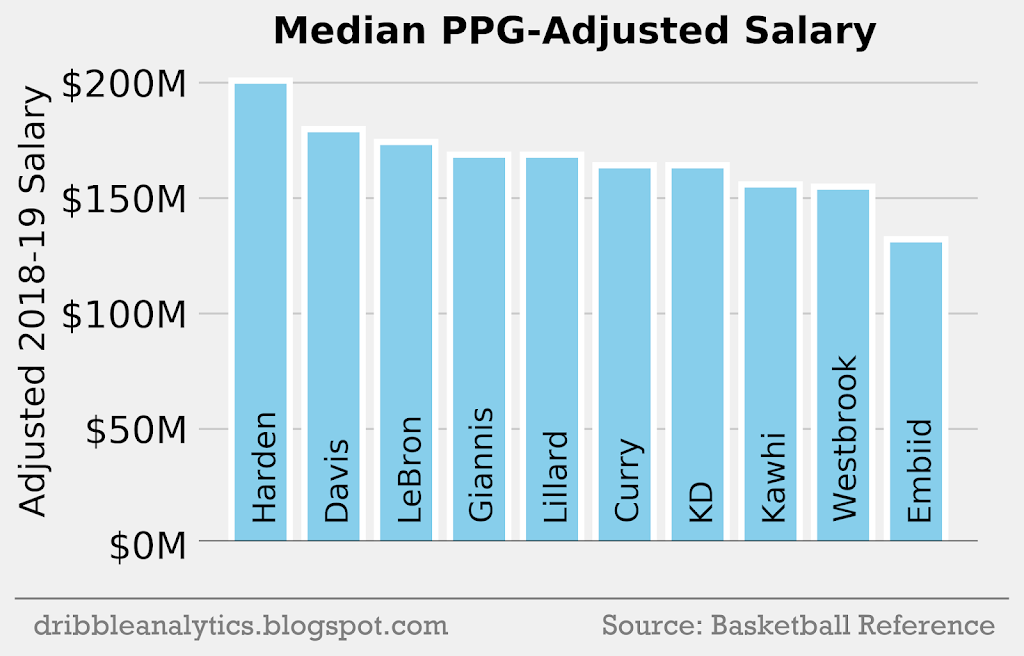
- The negative values from method 1 are kept negative. This makes players who have a WS and PPG below the median negatively affect the salary. (This will produce the highest result of the 3 methods).
This process tells us how much a player would earn if he was paid at the same $/stat as the rest of the league and there was no price ceiling.
Stats correlating to salary
Theoretically, a player’s salary should be directly related to their total performance on the court. No advanced stat perfectly measures a player’s total impact, but we can look at the relation between salary and BPM, VORP, and WS. Additionally, players who score more will in general be better, and will therefore earn higher salaries. So, let’s see the correlation between salary, PPG, and the 3 box score stats mentioned above:
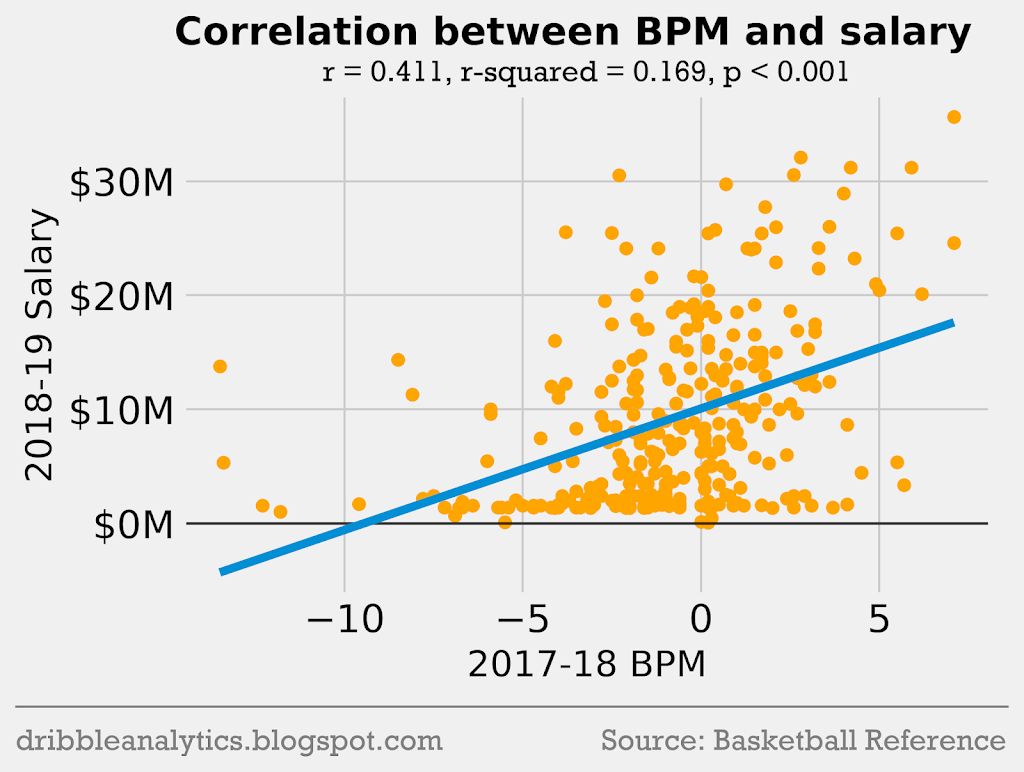
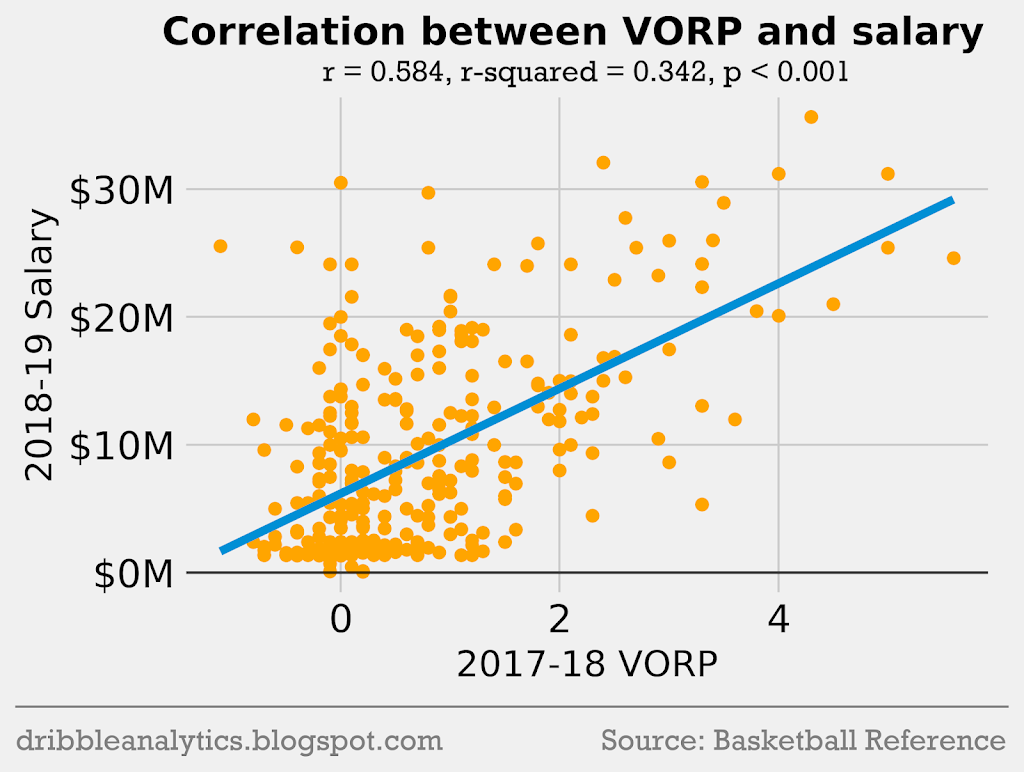
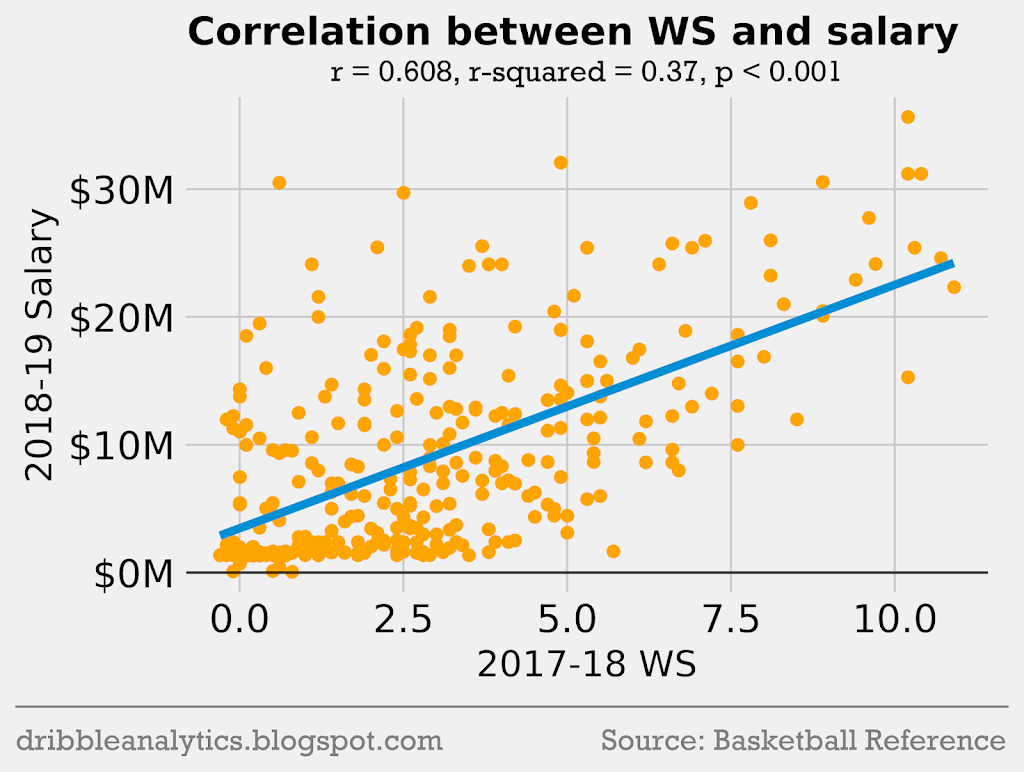
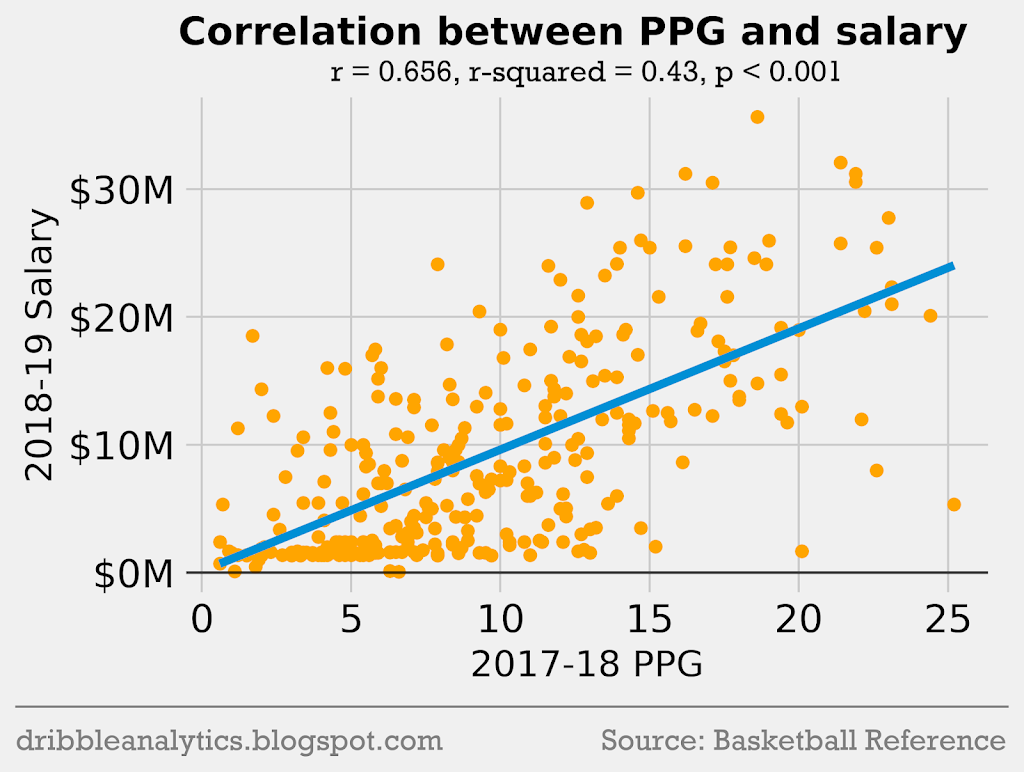
Each correlation is statistically significant (p < 0.05). However, all the correlations are weak; the highest r-squared is only 0.43 (between salary and PPG). In general, these stats do give a neighborhood for each player’s salary.
Salary adjusted for $/stat
Along with the above factors, I adjusted the top 10 players’ salaries to their OBPM.
Salary per OBPM
The graph below shows the salary adjusted for OBPM.
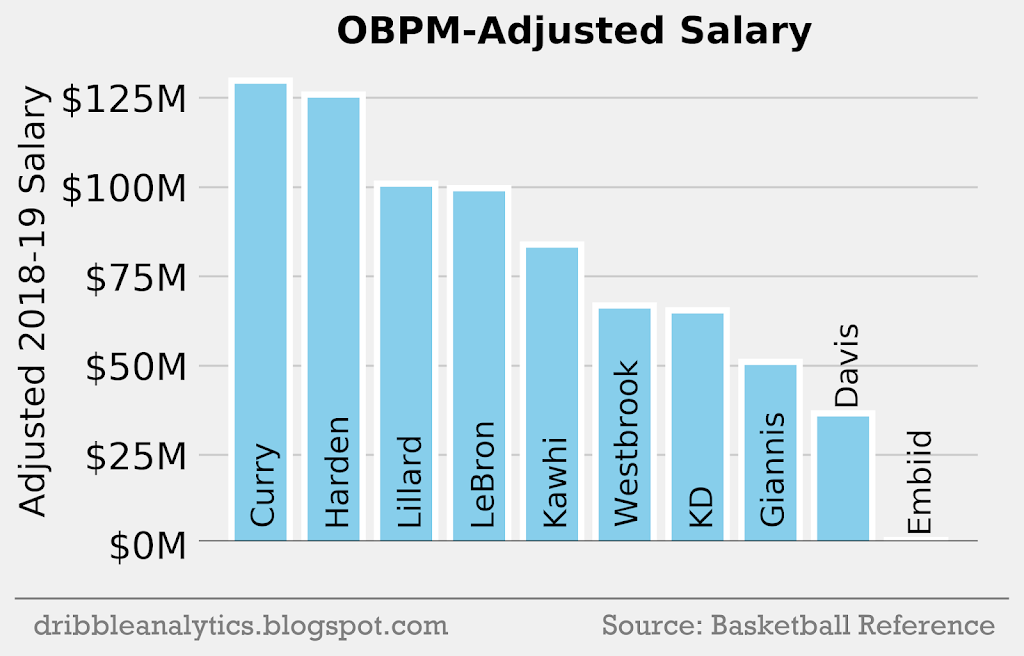
Last year, Embiid had an OBPM very close to 0, leading to his low salary. Meanwhile, the top guards lead the league in OBPM, making Curry, Harden, and Lillard the top-3 highest paid players with this adjustment.
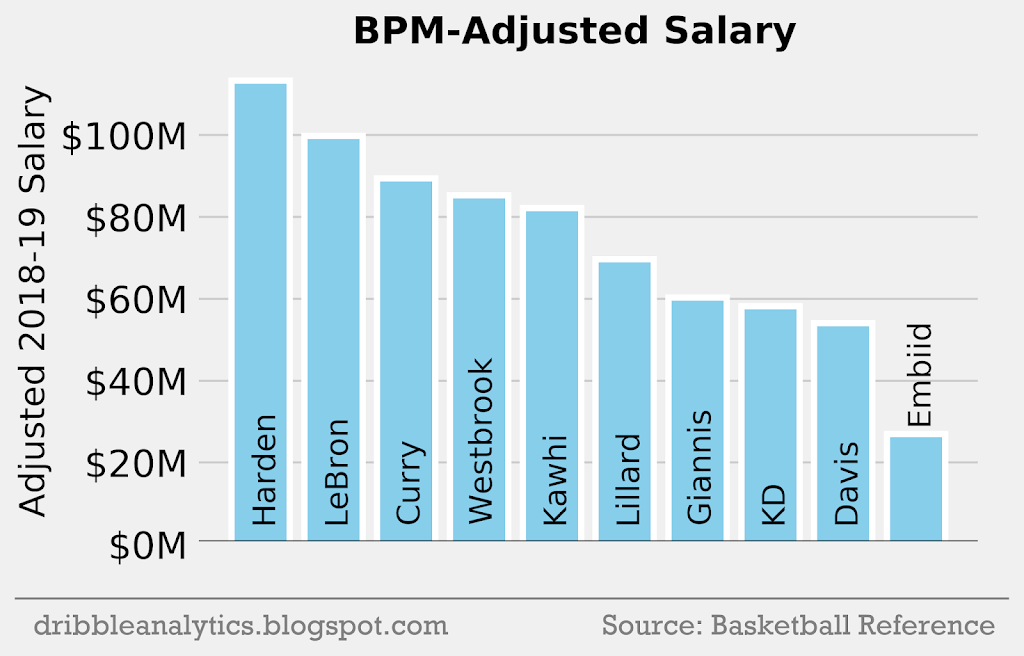
Salary per BPM
The graph below shows the salary adjusted for BPM. This will give us a more well-rounded view than the OBPM-adjusted salary.
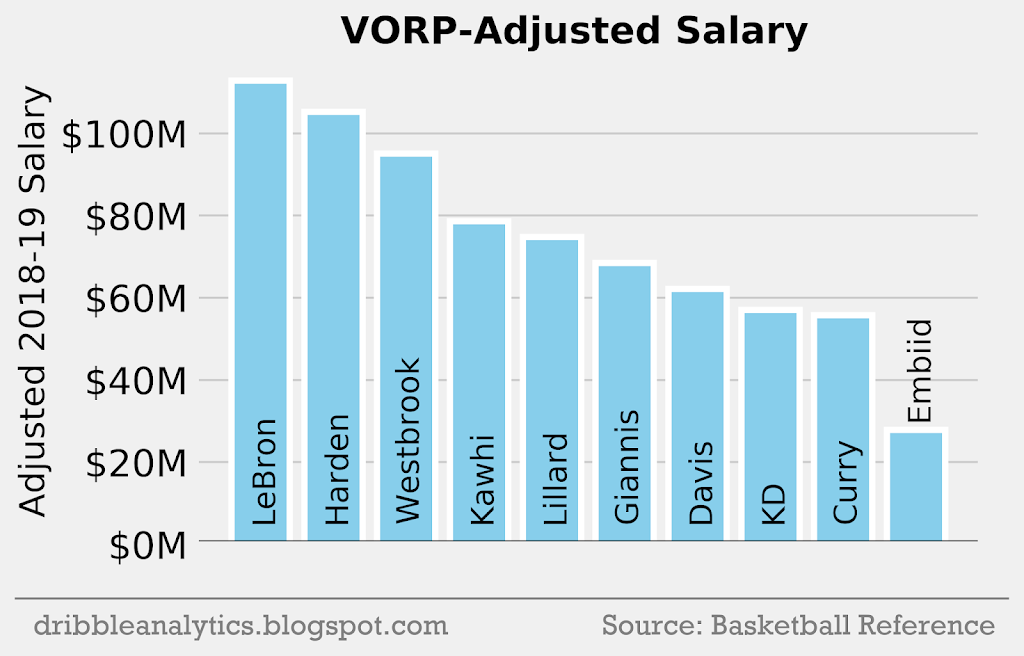
Salary per VORP
VORP is just a minutes scalar of BPM, so we’d expect the results to be very similar with adjustments for minutes. This will make injured players such as Curry appear to be less valuable.
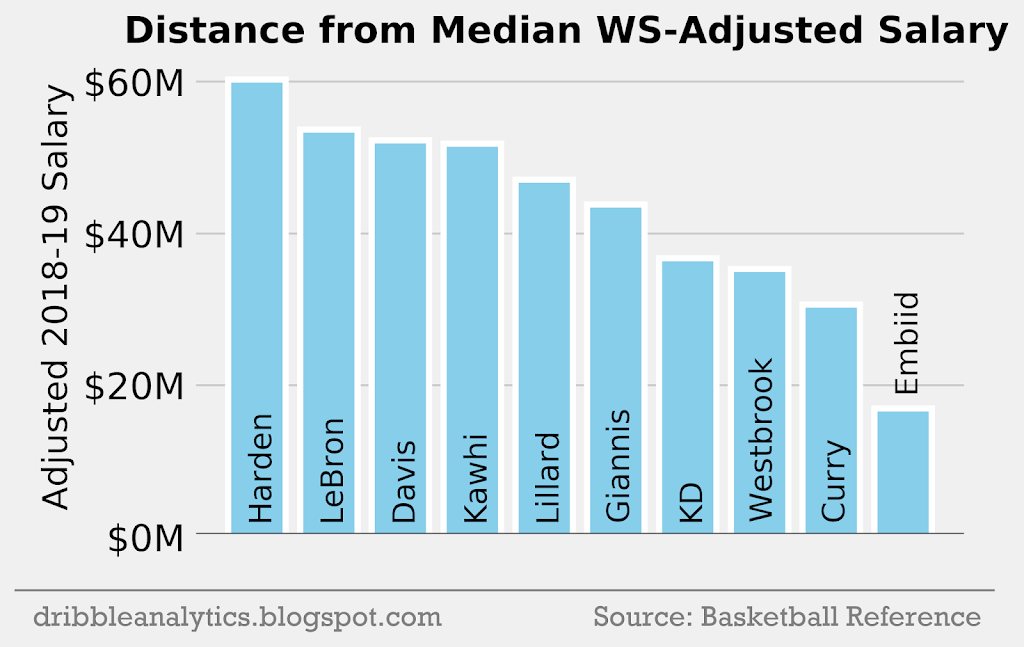
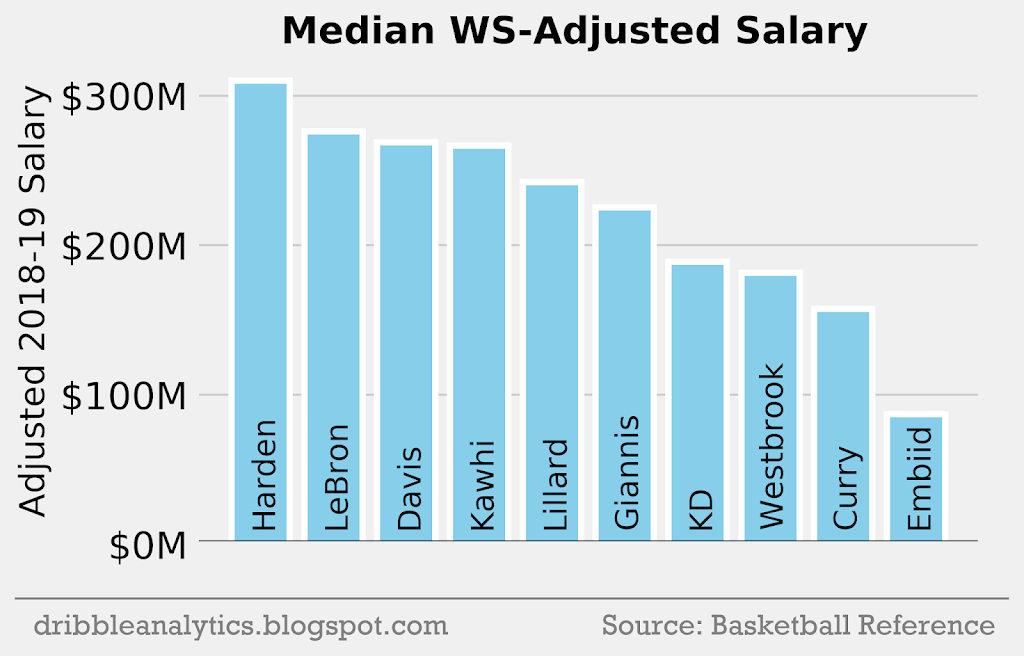
Salary per WS
Below is the WS-adjusted salary using the first method mentioned before (where the absolute value of each player’s WS minus the median WS is added).
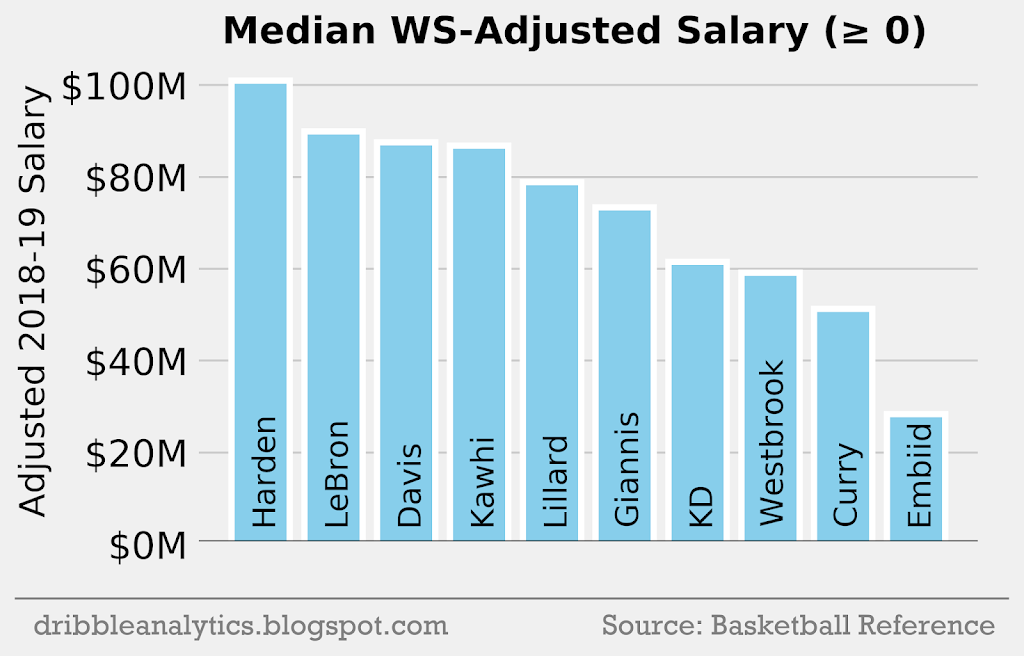
The graph below uses the second method discussed, where instead of taking the absolute value, all negative values are adjusted to 0.
The graph below uses the third method, where all negative values are left negative.
Salary per PPG
The three graphs below show the PPG-adjusted salary using methods 1, 2, and 3.